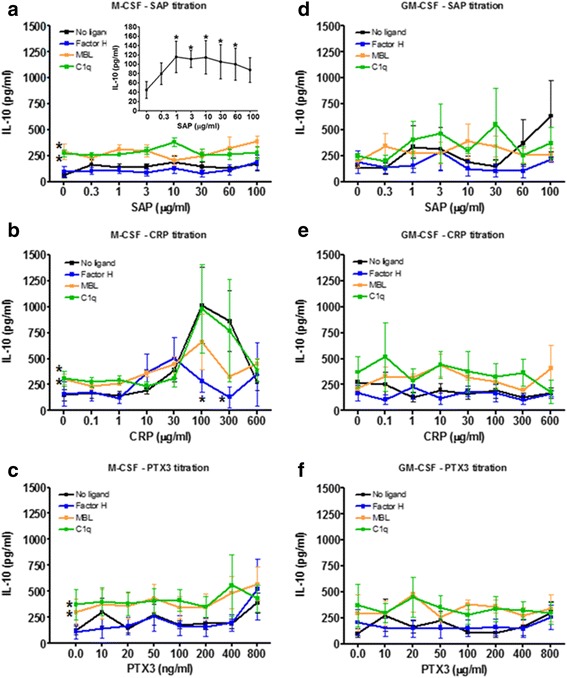
Fig. 6.

Effect of priming, pentraxin concentration and pentraxin ligands on IL-10 production. PBMC were cultured in (a-c) M-CSF or d-f) GM-CSF for 6 days and then with increasing concentrations of (a, d) SAP, b, e) CRP, or c, f) PTX3, in the presence or absence of factor H (100 μg/ml), MBL (2 μg/ml), or C1q (30 μg/ml), for an additional two days. Supernatants were then collected from the cells and assessed by ELISA for IL-10. Insert shows IL-10 production by SAP alone. Values are mean ± SEM (n = 8 SAP for M-CSF; n = 9 CRP for M-CSF; n = 9 PTX3 for M-CSF, n = 5 SAP for GM-CSF; n = 9 CRP for GM-CSF; n = 5 PTX3 for GM-CSF per group). *p < 0.05 (1-way ANOVA with Dunn’s test)
