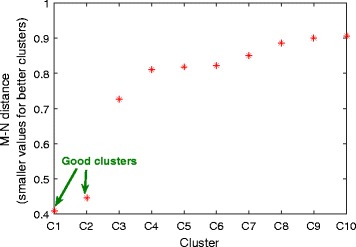
Fig. 1.

M-N scatter plots’ distances. Quality evaluation of the first ten clusters selected by the M-N scatter plots technique. Quality is quantified by the M-N distance metric, which has smaller values for better clusters. The M-N plots technique inherently orders the clusters that it selects from the best to the worst. In this Figure, it is clear that the first two clusters have significantly smaller M-N distance values than the rest, and therefore they are labelled as “good clusters” and are exclusively considered for downstream analysis
