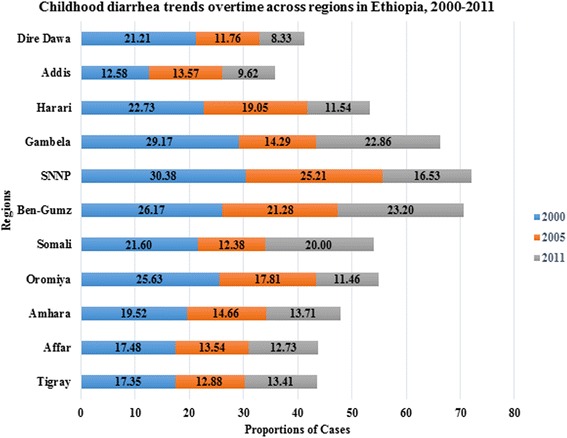
Fig. 2.

Childhood diarrhea trends overtime across Regions in Ethiopia, 2000, 2005 and 2011. This stacked bar chart shows the magnitude of childhood diarrhea observed among regions with their time trends. The numbers labelled on each bar shows diarrhea prevalence (%). Its magnitude was reduced from 2000 to 2005 in all regions, but increased from 2005 to 2011 in Gambella, Benshangul-gumuz, Somali, and Tigray regions
