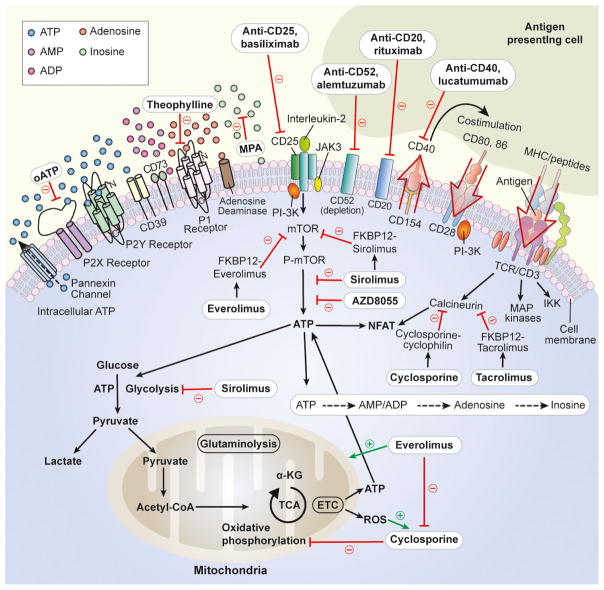
Figure 3. Immunosuppressive drugs and purinergic signaling.
The intracellular or extracellular site of action of immunosuppressive drugs is shown. Green arrows indicate a stimulatory effect. Red lines indicate an inhibitory effect. ADP, adenosine diphosphate; AMP, adenosine monophosphate; ATP, adenosine triphosphate; CoA, coenzyme A; CD, cluster of differentiation; ETC, electron transport chain; FKBP, FK506 binding protein; IKK, I-kappa-B kinase; JAK, janus kinase; KG, ketoglutarate; MAP, mitogen-activated protein; MHC, major histocompatibility complex; MPA, mycophenolic acid; mTOR, mammalian target of rapamycin; NFAT, nuclear factor of activated T cells; oATP, oxidized adenosine triphosphate; P1/2, purinergic 1/2; P-, phospho-; PI-3K, phosphoinositide 3-kinase; ROS, reactive oxygen species; TCA, tricarboxylic acid; TCR, T cell receptor.

