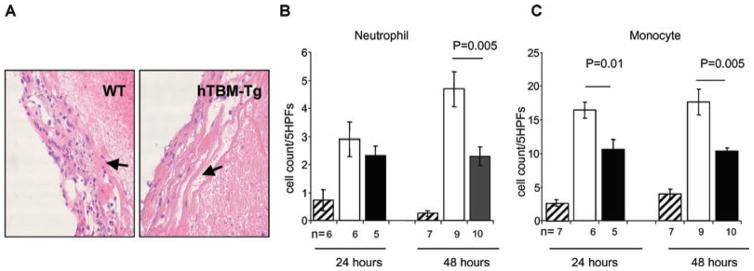
Figure 5. Stasis-induced venous thrombosis model: vena cava histopathology.
(A) Representative histopathology (H&E stain, magnification 200×) of WT and hTBM-Tg vena cava showing thrombosis-associated inflammation. (B and C) Quantitation of the inflammatory infiltrate (B and C, neutrophils and monocytes, respectively) at 24 and 48 h (Sham: striped bars; WT: white bars; hTBM-Tg: black bars).

