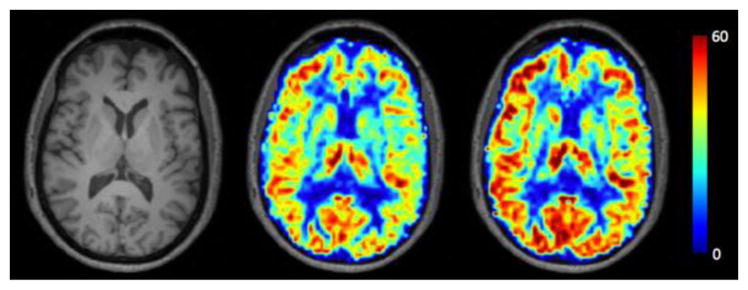
Fig. 1.

Example of CBF and CVR Images, Images from a representative subject displaying the T1-weighted image (left) with the corresponding normocapnia CBF image (center) and hypercapnia CBF image (right). Darker red colors indicate higher levels of CBF, while blue indicates low CBF. CBF scales between 0–60 ml/100g/min.
