FIG. 3.
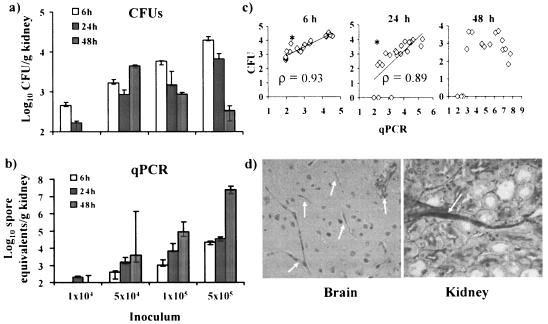
qPCR measurement better reflects progression of R. oryzae infection in kidneys than CFU quantitation. Log10 CFU (a) and log10 spore equivalents (b) per gram of kidney tissue as functions of the inoculum at various time points after infection are shown. The limit of detection for the qPCR assay is 1.99 log10 spore equivalents per gram of kidney tissue. Data are displayed as medians ± interquartile ranges. (c) Log10 CFU (y axis) versus log10 spore equivalents (x axis) per gram of kidney tissue at various time points (n = 5 mice per group). ρ was determined by the Spearman rank sum test. *, P < 0.05. (d) Periodic acid-Schiff staining of brain and kidney tissues from diabetic mice infected for 48 h with 5 × 10⁵ spores of R. oryzae. Arrows indicate R. oryzae hyphae in tissue. Magnifications, ×400.

