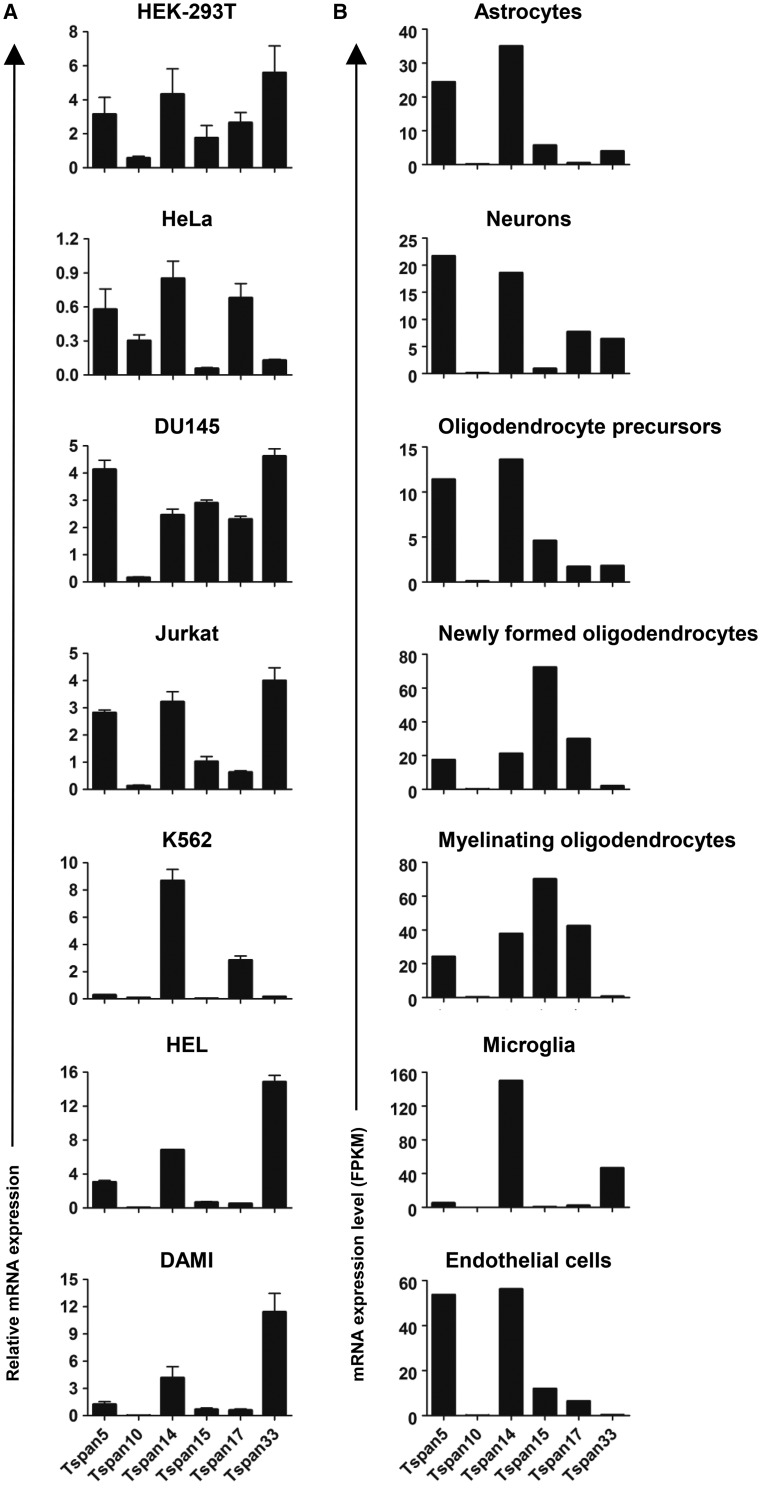
Figure 5. Different cell types express distinct repertoires of TspanC8s.
(A) The mRNA levels of TspanC8s in different human cell lines were measured by quantitative real-time polymerase chain reaction, as previously described [40]. The cell lines were human embryonic kidney 293 cells expressing the large T antigen of SV40 virus (HEK-293T), HeLa epithelial cells, DU145 prostate cancer cells, Jurkat T cells, K562 chronic myelogenous leukaemia cells, human erythroleukaemia cells (HEL) and DAMI megakaryoblast cells. (B) An RNA-Seq dataset from mouse brain for seven major cell types, generated by Zhang et al. [49], was used to present mRNA expression levels for TspanC8s as fragments per kilobase of transcript sequence per million mapped fragments (FPKM).

