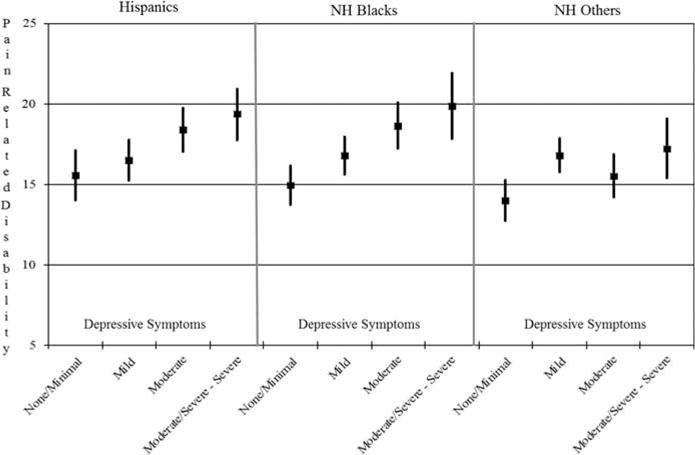
FIGURE 2.

Adjusted mean pain-related disability score as depressive symptoms increase by race-ethnicity. All data points and SEs in the figure have been adjusted by the factors included in the model presented in Table 3. Within each race/ethnicity group, the difference in mean pain-related disability between lowest (none/minimal) and highest (moderate/severe or severe) depressive symptom groups is: Hispanic −3.80 (P = 0.001); NH black −4.94 (P < 0.001); NH other −3.23 (P =0.006). The test for linear trend by race/ethnicity groups is: Hispanic 3.32 (P < 0.001); NH black 4.17 (P < 0.001); NH other 2.10 (P = 0.02). The difference between race/ethnicity groups in linear trend is: Hispanic versus NH other 1.22 (P = 0.30); NH black versus NH other 2.07 (P = 0.09); Hispanic versus NH black −0.85 (P = 0.50). NH black indicates non-Hispanic black; NH other, non-Hispanic others.
