Figure 1.

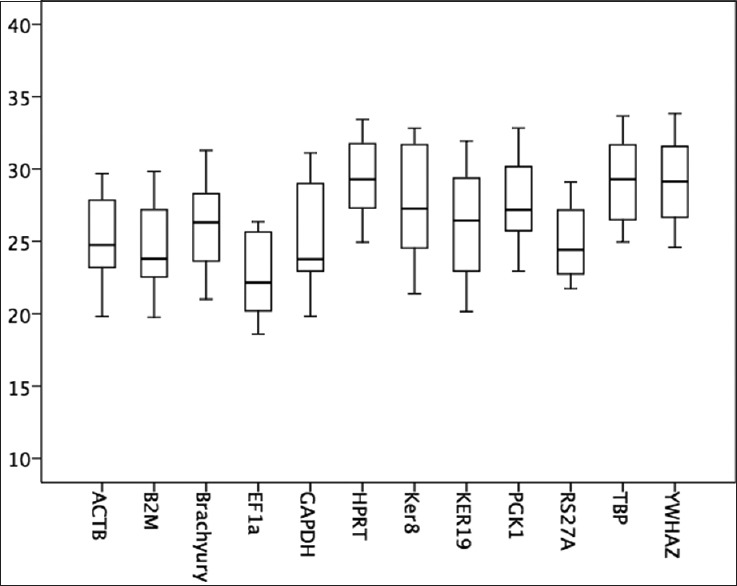
Boxplot of the tested reference genes. The horizontal line marks the median, the box indicates the 25/75 percentiles and the whisker caps indicate the 10/90 percentiles. The y-axis shows the Ct values of the different reference genes

Boxplot of the tested reference genes. The horizontal line marks the median, the box indicates the 25/75 percentiles and the whisker caps indicate the 10/90 percentiles. The y-axis shows the Ct values of the different reference genes