Figure 2.

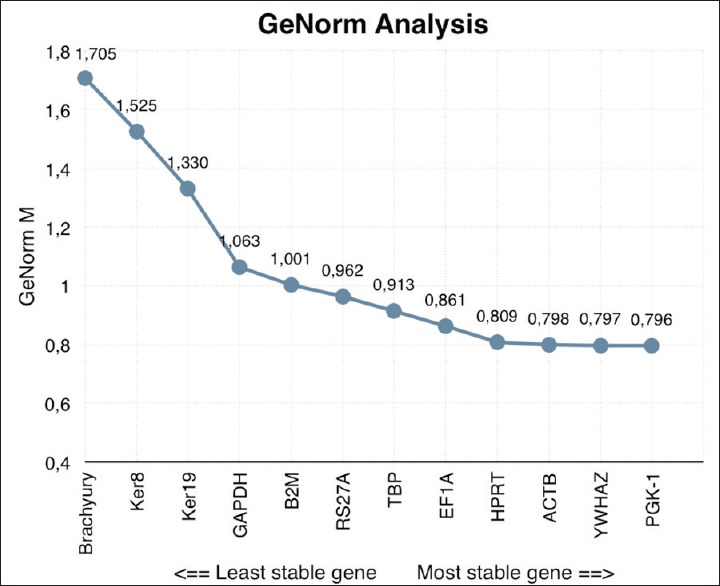
GeNorm gene stability analysis. On the horizontal axis, the analyzed genes are distributed from least (left) to the most stable expressed gene (right). The stability is quantified with a GeNorm M value, as indicated on the y-axis

GeNorm gene stability analysis. On the horizontal axis, the analyzed genes are distributed from least (left) to the most stable expressed gene (right). The stability is quantified with a GeNorm M value, as indicated on the y-axis