
Figure 4.
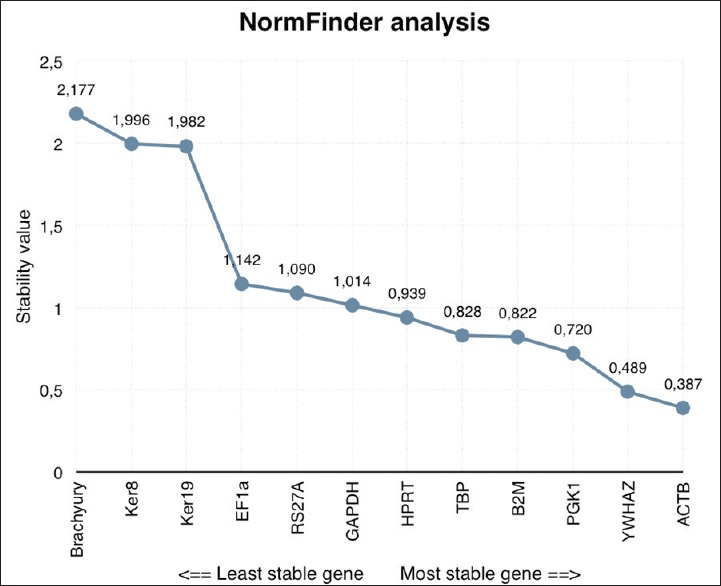
NormFinder gene stability analysis. On the horizontal axis the analyzed genes are distributed from the least (left) to the most stable gene (right). The y-axis marks the stability value
Official websites use .gov
A
.gov website belongs to an official
government organization in the United States.
Secure .gov websites use HTTPS
A lock (
) or https:// means you've safely
connected to the .gov website. Share sensitive
information only on official, secure websites.
NormFinder gene stability analysis. On the horizontal axis the analyzed genes are distributed from the least (left) to the most stable gene (right). The y-axis marks the stability value