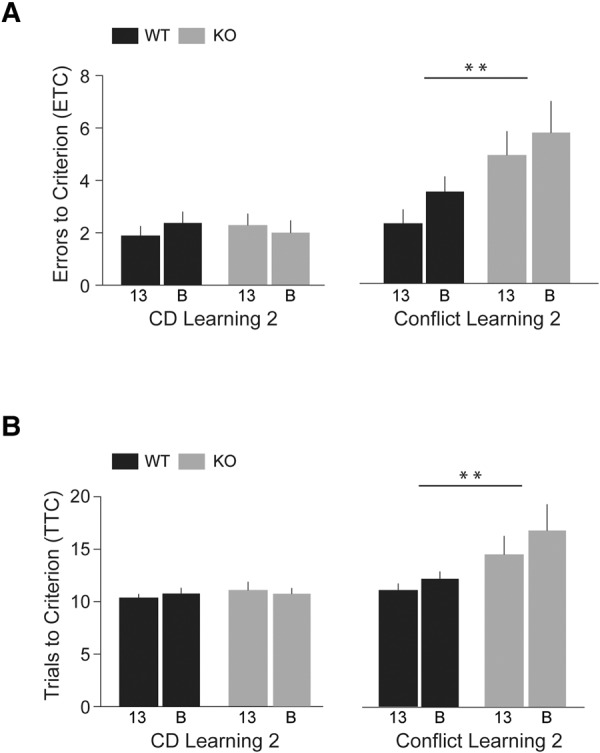
Figure 3.

Compound Discrimination (CD) Learning 2 and Conflict Learning 2 (Phase 2, IDS). Numbers of ETC (A) and TTC (B) were recorded. Following a change of all stimuli (Table 1), KO and WT mice performed comparably in session Compound Discrimination Learning 2 (left panels, HR = 0.92, 95% CI 0.61–1.38, P = 0.68). However, KO mice displayed significant deficits in session Conflict Learning 2 (right panels, HR = 0.38, 95% CI 0.21–0.71, P = 0.002) as they committed more ETC and required more TTC than WT mice. There was no significant difference between the performance of line 13 animals and line B animals in Compound Discrimination Learning and in Conflict Learning (HR = 1.04, 95% CI 0.67–1.62, P = 0.86 and HR = 1.50, 95% CI 0.87–2.59, P = 0.15, respectively; not shown). KO-13 and WT-13 groups: n = 10 each; KO-B and WT-B groups: n = 8 each.
