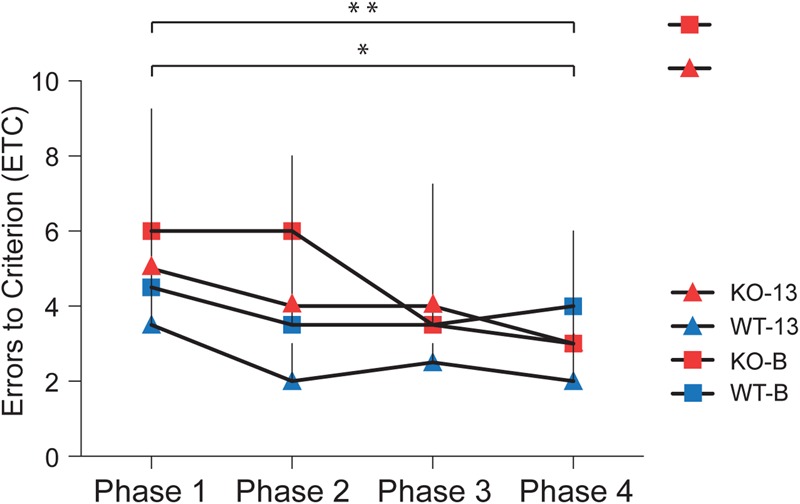
Figure 6.

Conflict learning curve analysis of the median ETC (including interquartile ranges, IQR) for the four animal groups. Conflict learning performance of both KO-13 animals and KO-B animals improved significantly across the four phases (P = 0.03 and P = 0.005, respectively) whereas no such improvement was apparent for the performance of WT-13 or WT-B animals (P = 0.08 and P = 0.71, respectively).
