
Figure 4.
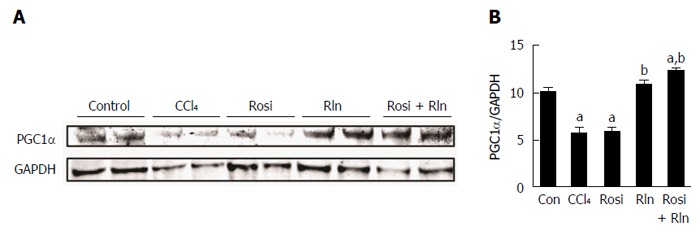
Western blotting of PGC1α content in livers from control (Con), fibrotic (CCl4), rosiglitazone (Rosi), serelaxin (Rln) or combination-treated (Rosi + Rln) mice. A: Liver tissue extracts were analyzed by Western blotting for PGC1α. The levels of GAPDH are shown as a loading control; B: The levels of PGC1α relative to GAPDH were determined by densitometry. Data are shown as mean Data are expressed as mean ± SE, and analyzed by ANOVA (n = 5). aP < 0.05 vs Con; bP < 0.01 vs CCl4 or Rosi.