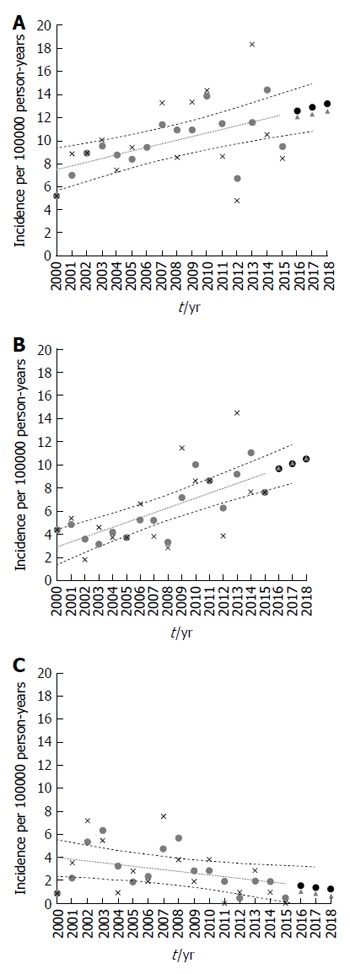
Figure 4.

Scatter plots of the data. The average annual age-standardized incidence rate per 100000 person-years by age group (< 19 years) and the 16-year trend for inflammatory bowel disease (A), Crohn’s disease (B), and ulcerative colitis (C) in the Pilsen region over the period of 2000-2015 in the population under observation and the incidence rate projected for 2016-2018. The points are the actual data; Stars indicate the incidence of IBD (A), CD (B) and UC (C) per 100000 person-years; Blue points indicate calculating the moving average; Dotted blue line indicates a fitted linear regression model to predict trends; Triangles indicate the incidence rate projected for 2016-2018; Red points indicate calculating the moving average. There was a significant increase in incidence over the 16-year period (A: r = 0.32, P = 0.012; B: r = 0.42, P < 0.0001; C: r = - 0.15, P = 0.134).
