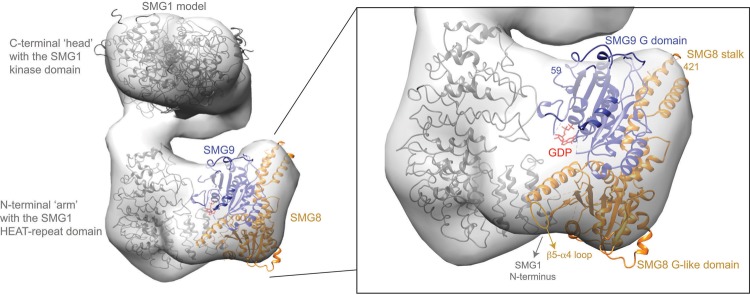
FIGURE 3.
Pseudo-atomic model of a SMG1–SMG8–SMG9 complex. In gray is the EM density of a human SMG1–SMG8–SMG9 complex fitted with a model of human SMG1, as in Deniaud et al. (2015). The remaining density was fitted with the crystal structure of the C. elegans SMG8–SMG9 core complex (which lacks the low-complexity SMG9 N-terminal and SMG8 C-terminal regions). In red is the GDP molecule bound to SMG9. The fitting was done in Chimera (Pettersen et al. 2004).

