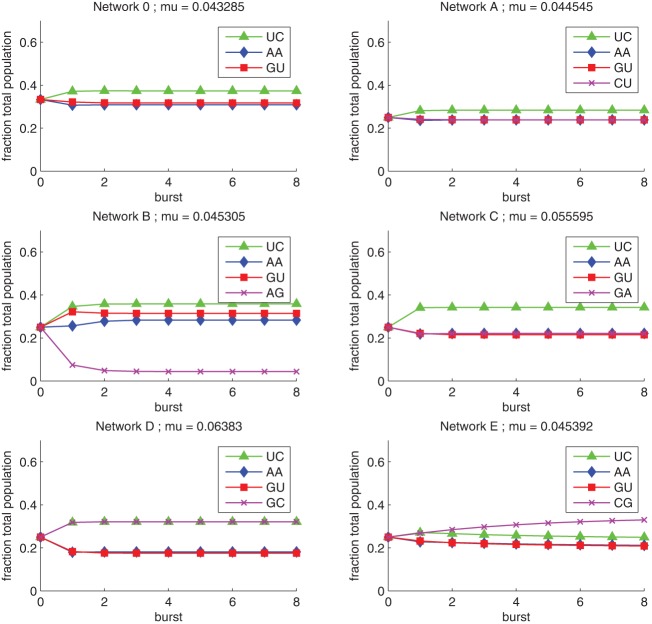
FIGURE 5.
Predicted dynamics of the six RNA self-assembly networks shown in Figure 2. See text for the mathematical approach used. These predictions match experimental results shown in Figure 4 well, especially in terms of ordinal ranking of genotypes; see Figure 6. Mu represents the predicted total network growth rate constants.

