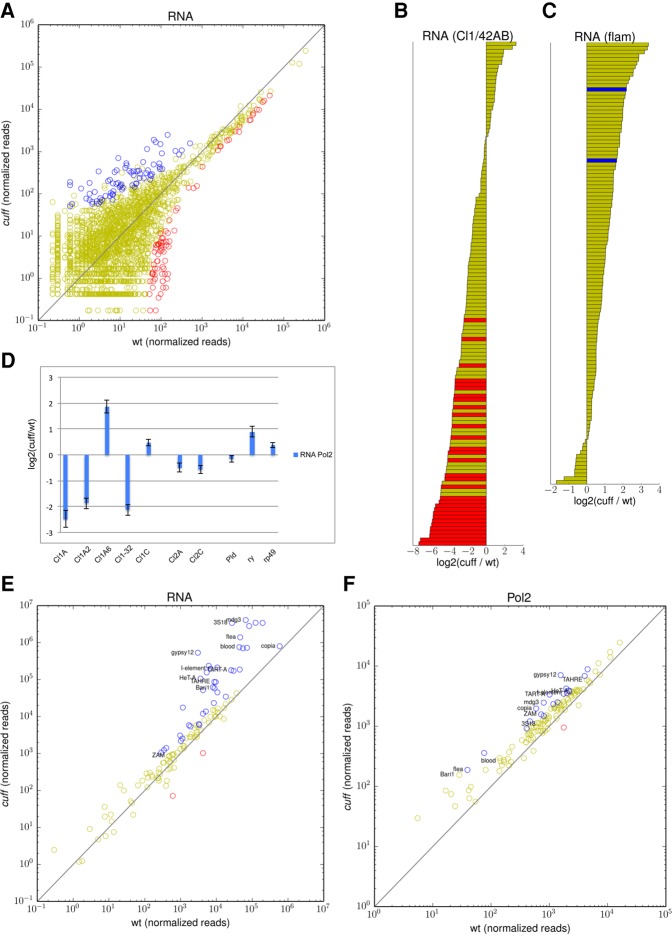
FIGURE 2.
Mutations in Cuff alter the transcription of piRNA clusters and transposable elements. (A) Steady-state RNA levels at piRNA clusters. Scatter plot displays 500-bp fragments of piRNA clusters that are up-regulated (blue dots), down-regulated (red dots), or not significantly affected (yellow dots) in the cuff ovaries (normalized read counts). (B,C) Barplot displaying the fold difference between cuff and wild-type ovaries [log2 (cuff/wt)] at 500-bp fragments of Cl1/42AB and flam. Fragments with significantly higher (blue bars) and lower (red bars) expression levels in the cuff mutant are shown. Yellow bars indicate regions that were not significantly affected by mutations in Cuff. (D) RNA Pol2 occupancy was analyzed by ChIP-qPCR at specific positions at Cl1/42AB, Cl2, and the control Pld, ry, and rp49 genes. Values are reported as fold difference between cuff and wt [log2 (cuff/wt)]. Error bars represent standard deviation. (E) Scatter plot displaying the distribution of the RNA-seq reads mapping to canonical transposon families in cuff versus wild-type ovaries. Transposons that are up-regulated (blue dots), down-regulated (red dots), or not significantly altered (yellow dots) in the cuff ovaries are reported. Shown on the x- and y-axes are consensus normalized read coverage values computed over replicates. (F) Scatter plot displaying the distribution of RNA Pol2 ChIP-seq reads mapping to canonical transposons in cuff versus wild-type ovaries. Transposons showing increased (blue dots), reduced (red dots), or unaltered (yellow dots) Pol2 occupancy in the cuff mutant are indicated. Shown on the x- and y-axes of scatter plots are consensus normalized read coverage values computed over replicates.

