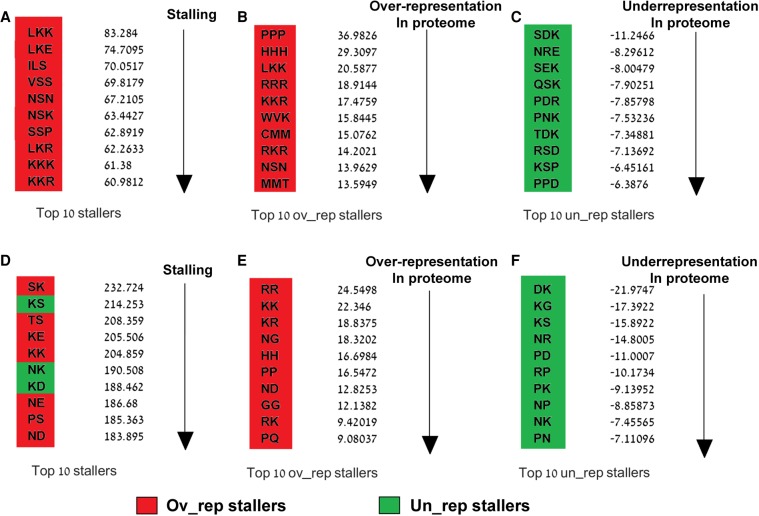
FIGURE 3.
Ranking the stalling motifs. Red and green cells represent over- and underrepresented peptide sequences, respectively. (A,D) Top 10 stalling. Stalling Z-scores based on which peptides were ranked (Materials and Methods) are presented to the right. (B,E) Top 10 overrepresented stalling peptide sequences. Overrepresented Z-scores based on which peptides were ranked (Materials and Methods) are presented to the right. (C,F) Top 10 underrepresented stalling peptide sequences. Underrepresented Z-scores based on which peptides were ranked (Materials and Methods) are presented to the right.

