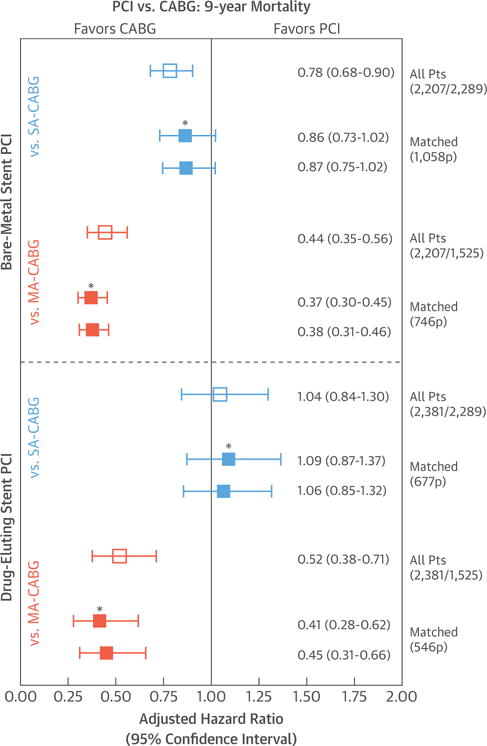
FIGURE 4. Pairwise Adjusted Hazard Ratios of CABG Versus PCI Modalities.

Risk-adjusted 9-year all-cause mortality CABG-to-PCI hazard ratios derived for both the BMS-PCI and DES-PCI treatment cohorts when each is compared with the SA-CABG and MA-CABG surgical treatments. Solid squares reflect hazard ratios derived in matched patient cohorts (*additional adjustment for left main disease, which was not included in propensity models). Open squares reflect hazard ratios derived from all available patients using forced risk-adjustments (22 factors) via proportional hazard Cox regression. Pts = patients; other abbreviations as in Figure 1.
