
Figure 1. Cell line based model of melanoma progression and epigenome profiling.
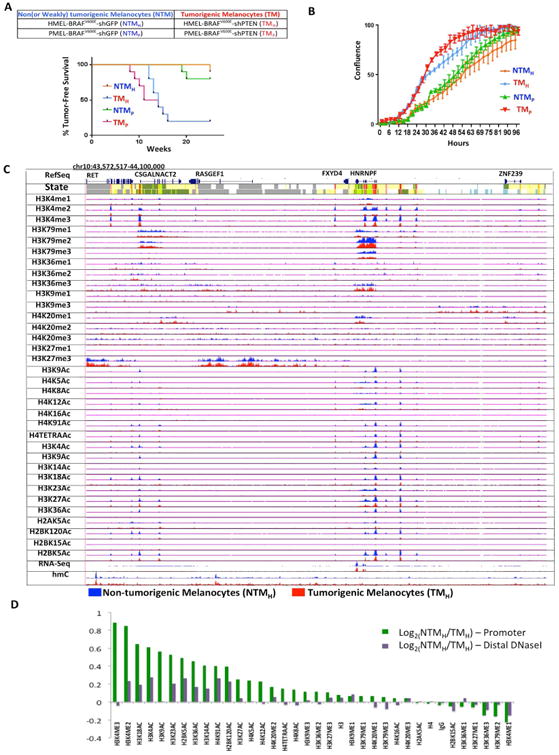
(A) Brief description of the primary melanocyte based model system that consists of two replicates of paired isogenic non (or weakly)-tumorigenic (NTMH, NTMP) and tumorigenic (TMH and TMP) cells. Kaplan-Meier curve showing tumor formation efficiency of NTMH, NTMP, TMH and TMP cells. NTMH and NTMP cells display long latency whereas TMH and TMP cells show shorter latency for tumor formation. Mantle-Cox p = .0007 for NTMH vs TMH and p = 0.0016 for NTMP vs TMP (B) Proliferation curve showing differences in cell confluence (Y-axis) in NTMH vs TMH and NTMP vs TMP as a function of time (X-axis). (C) Normalized signal of all profiled chromatin marks, IgG control and RNA-Seq in an example region (chr10:43,572,517-44,100,000) for NTMH (blue) and TMH (red) cells. Chromatin state tracks and gene annotations are also shown. (D) Log2 ratio between NTMH and TMH cells for the average signal strength of each chromatin mark in a window of 2kb around annotated transcription start sites from RefSeq (Green) and on DNaseI hypersensitive sites from ‘Melano’ (Purple) cell lines from ENCODE. See also Figure S1 and Table S1.