
Figure 2. Chromatin changes are reflected in human tumors. (A-B).
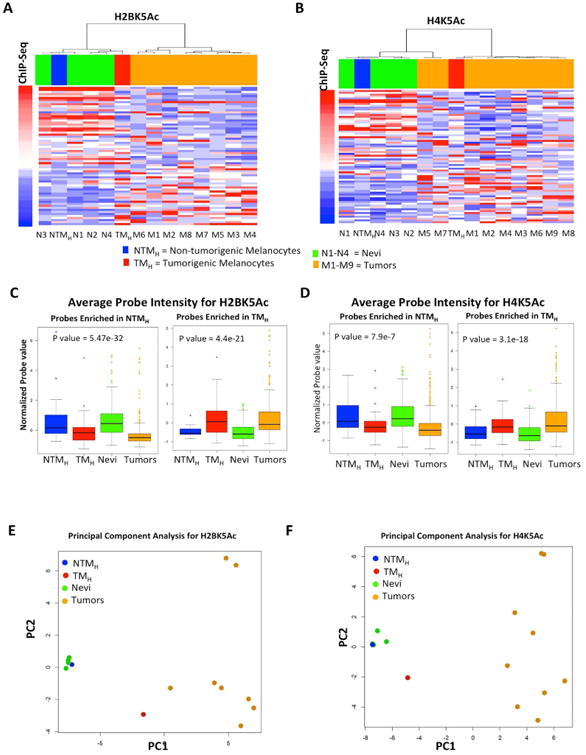
Heat map for H2BK5Ac (A) and H4K5Ac (B) showing enrichment in NTMH, TMH, 4 nevi samples (N1-N4) and in up to 9 melanoma tumor samples (M1-M9) as calculated by ChIP-String assay. Probes are ordered with increasing ChIP-Seq signal in TMH cells. Columns are ordered based on hierarchical clustering. (C-D) Boxplots showing average normalized intensity for ChIP-string probes across NTMH, TMH, nevi and tumors (Averaged over all enriched probes across all samples for Nevi and tumors). (E-F) PCA plot for H2BK5Ac (C) and H4K5Ac (D) showing relationship between NTMH, TMH, 4 nevi samples (N1-N4) and up to 9 melanoma tumor samples (M1-M9) as calculated by ChIP-String assay. Asterisk (*) represents p<0.05 and double asterisk (**) represents p<0.001. See also Figure S2 and Tables S2-S3.