
Figure 3. Chromatin state predictions for non-tumorigenic and tumorigenic melanocytes.
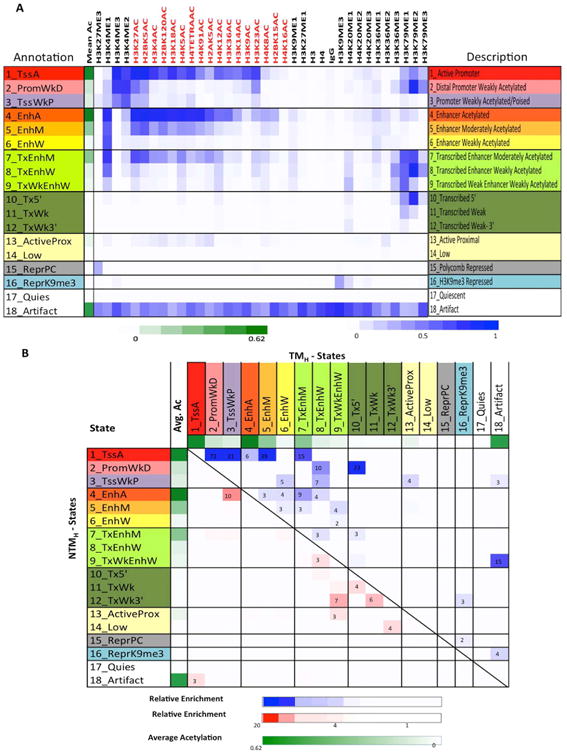
(A) Emission probabilities of the 18-state ChromHMM model (see Figure S3A for transition probabilities). Each row represents one chromatin state. First column gives state number and mnemonic and last column gives the candidate state description. Second column indicates the intensity of mean acetylation from zero (white) to 0.62 (green), which is the maximum mean acetylation across all states. Remaining columns each correspond to one chromatin mark with the intensity of the color in each cell reflecting the frequency of occurrence of that mark in the corresponding chromatin state on the scale from 0 (white) to 1 (blue). (B) Heat map showing fold enrichment of transitions of chromatin states in non-tumorigenic (NTMH) to tumorigenic (TMH) cells controlling for the overall state size and similarity (Supplementary Methods). The color intensities above (below) the main diagonal range from white (relative enrichment <1) to blue (red) (relative enrichment > 20), thus indicating chromatin state transitions that lose acetylation marks from NTMH to TMH within the same category are more enriched compared to the reverse chromatin state transition (i.e. from TMH to NTMH) and the lack of those that gain acetylations. See also Figure S3, S4 and Table S4.