
Figure 5. Correspondence of chromatin state changes with RNA expression changes during transition to tumorigenesis.
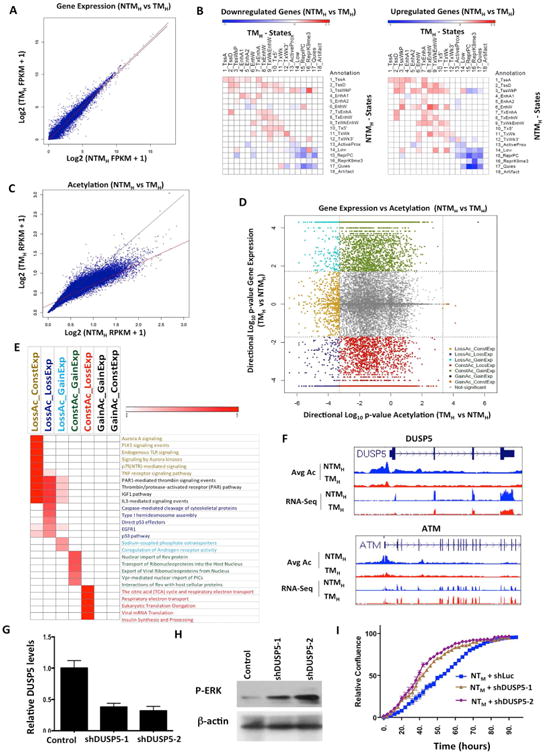
(A) Scatter plot comparing gene expression values [log2 (FPKM+1)] in NTMH and TMH for RefSeq genes. (B) Relative enrichment of chromatin state transitions at promoters of down-regulated genes compared to up-regulated genes (left panel) or up-regulated genes promoters compared to down-regulated (right panel) for all pairs of chromatin state transitions. Red shows enrichment whereas blue is depletion. (C) Scatter plot comparing promoter acetylations [log2(RPKM+1)] around +/-2kb of each RefSeq gene in NTMH and TMH. The line in red is a regression line, while in black is the y=x line. (D) Scatter plot displays directional log10(p-value) for acetylation and gene expression changes between TMH and NTMH. Negative values represent genes with decreased expression or acetylation levels in TMH compared to NTMH cells. Dashed lines show the significance cut-off for acetylation or expression changes. Genes with significant gene expression and/or acetylation changes are colored based on grouping indicated. (E) Heat map represents enriched pathways (pathway commons) for each group identified in Figure 5D. Color scale represents –log10(HyperFdrQ corrected). (F) UCSC genome browser view of average acetylation and RNA-Seq for an example from each of the LossAc_LossExp (DUSP5) (top) and LossAc_ConstExp (ATM) groups (bottom). (G) Graph showing relative levels of DUSP5 in NTMH cells harboring either control or DUSP5 shRNAs. (H) Western blot showing levels of p-ERK in NTMH cells harboring either control or DUSP5 shRNAs. (I) Growth curve showing proliferative capacity of NTMH cells harboring control or DUSP5 shRNAs (shDUSP5-1 and shDUSP5-2). See also Figure S6 and Table S7.