
Figure 6. CBP loss in NTMH cells promotes tumorigenesis and mimics acetylation loss seen in TMH cells.
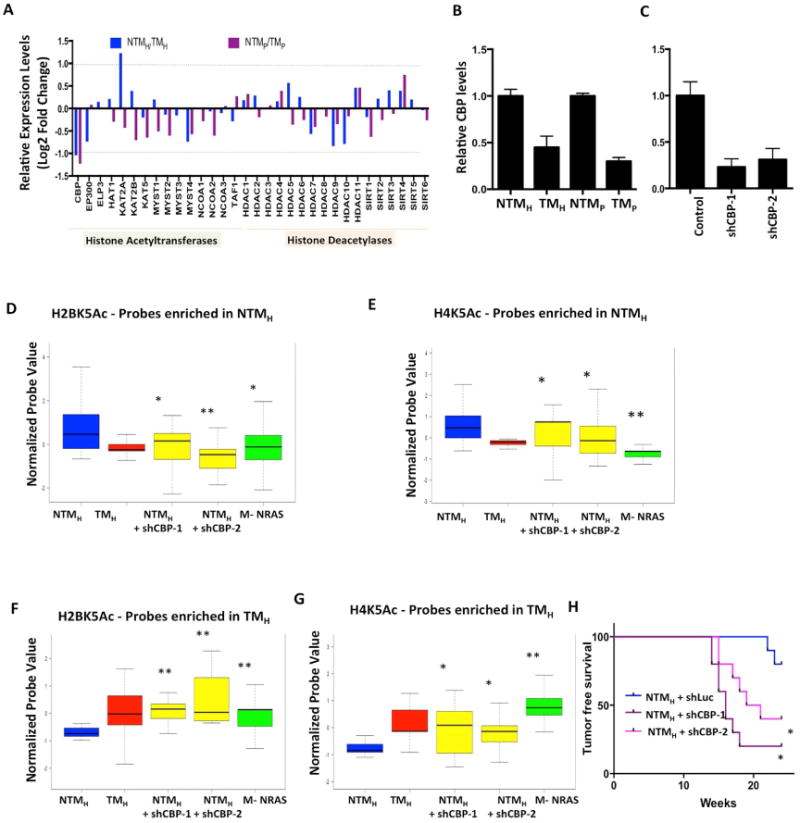
(A) Bar graph showing relative levels of 32 histone acetyltransferases and deacetylases between NTMH/TMH and NTMP/TMP cells. The Y–axis shows Log2 Fold Change values. The dotted line shows the cutoff of 2-fold change. (B-C) Graph showing relative levels of CBP histone acetyltransferase in (E) NTMH, TMH, NTMP and TMP cells and (F) NTMH cells harboring either control or CBP shRNAs. (D-G) Boxplots showing average normalized intensity for ChIP-string probes for (D, F) H2BK5Ac and (E, G) H4K5Ac in NTMH, TMH, NTMH cells harboring CBP shRNAs or NRASG12D expressing transformed melanocytes (M-NRAS). The plot is limited to those probes that were originally enriched in (D-E) NTMH cells or in (F-G) in TMH cells by ChIP-Seq experiments and validated by ChIP-String in Figure S2A-F. Asterisk (*) represents p<0.05 and double asterisk (**) represents p<0.001 (Wilcoxon Rank test) when comparisons are made to NTMH. (H) Kaplan-Meier curve showing tumor formation efficiency of NTMH cells harboring control or CBP shRNAs (shCBP-1 and shCBP-2).