
Figure 7. Acetylation status on deacetylated promoters in TH correlates with response to HDAC inhibitors. (A-B).
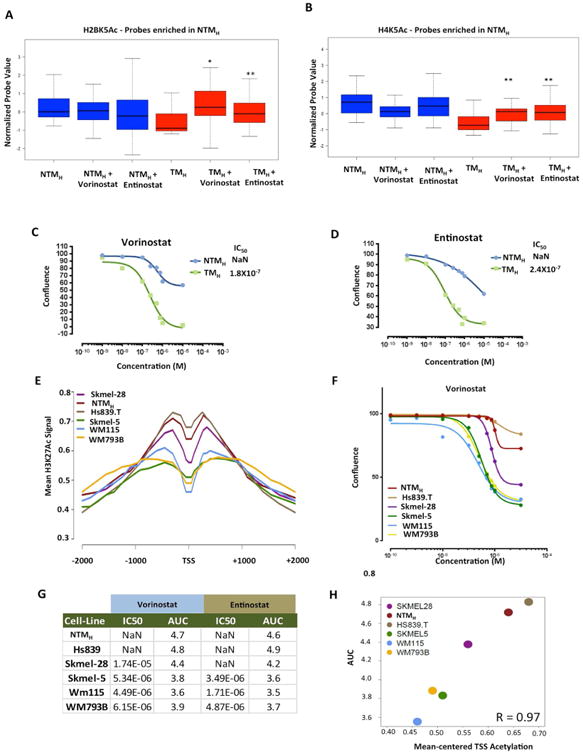
Boxplots showing average normalized intensity for (A) H2BK5Ac or (B) H4K5Ac on ChIP-string probes (that were enriched in NTMH cells by ChIP-Seq experiment) across NTMH and TMH cells that were either untreated or treated with vorinostat (200nM) or entinostat (300nM) for 72hrs. Asterisk (*) represents p<0.05 and double asterisk (**) represents p<0.001 (Wilcoxon Rank test) when comparisons are made to TMH. (C-D) Growth curves for NTMH and TMH cells grown under various concentrations of (C) vorinostat or (D) entinostat. (E) Aggregate plot showing H3K27Ac levels around +/-2Kb of deacetylated gene promoters (in TH cells) in various melanoma cell lines. (F) Growth curves for melanoma cell lines grown under various concentrations of vorinostat. (G) Table showing IC50 values (the concentration at which 50% response is achieved) and area under the curve (AUC) for two HDAC inhibitors, vorinostat and entinostat, in melanoma cells lines. Immmeasurable IC50 values are shown as NaN which refers to ‘not a number’. (H) Correlation plot between AUC and average H3K27Ac levels at TSS of gene promoters that showed loss of histone acetylation in TMH cells compared to NTMH cells. See also Figure S7.