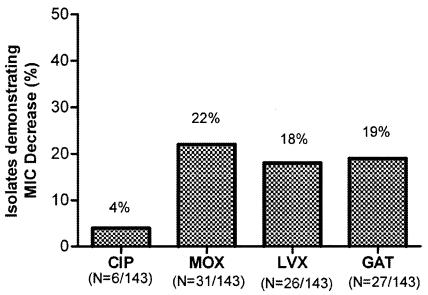
FIG. 2.
Effect of EPI on fluoroquinolone MICs. All strains were tested over the same range of concentrations (0.5 to 8 μg/ml) for all four FQ agents. n, number of strains showing at least an 8-fold decrease in MIC with an EPI; an additional 28 isolates showed a ≥8-fold decrease in the LVX MIC when tested at a broader concentration range (0.25 to 256 μg/ml). P was ≤0.0002 for CIP versus MOX, LVX, or GAT. P was >0.05 for comparison amongst MOX, LVX, and GAT.

