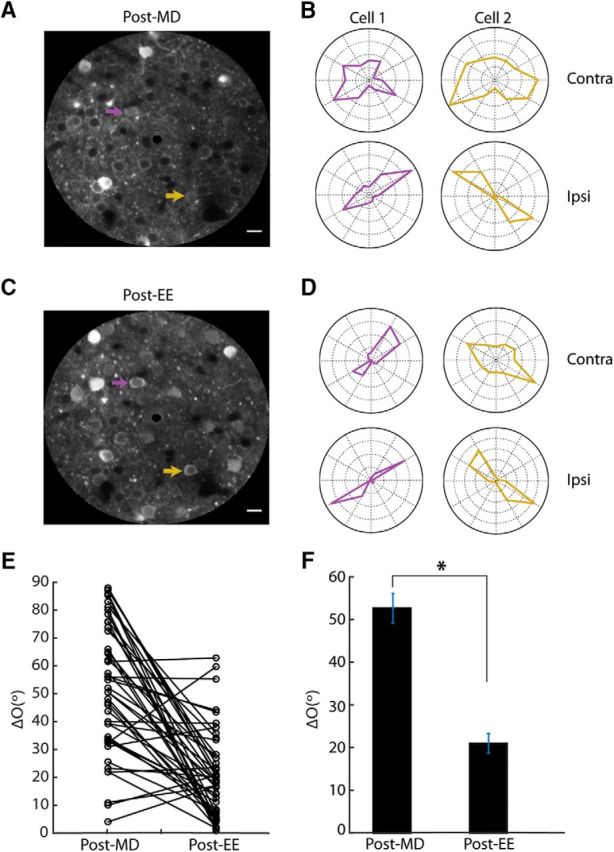
Figure 6.

Tracking EE-induced binocular matching by chronic two-photon calcium imaging. A, Averaged image of field-of-view from a mouse immediately following MD. Scale bars, 20 μm. B, Polar plots of responses from the two cells highlighted in A to drifting gratings presented separately to contralateral eye (top; outermost circle = 40% ΔF/F0 for cell 1, 40% ΔF/F0 for cell 2) and ipsilateral eye (bottom; outermost circle = 80% ΔF/F0 for cell 1, 200% ΔF/F0 for cell 2). C, Same field-of-view as in A, imaged again following 3 weeks of environmental enrichment. D, Polar plots of the same two example cells from A following EE (200% ΔF/F0 for cell 1, 80% ΔF/F0 for cell 2; 200% ΔF/F0, cell 1 150% ΔF/F0 for cell 2). E, ΔO values for all cells imaged chronically, following MD and again EE (n = 45 cells; 4 mice). Note that the vast majority (n = 38/45, 84%) showed a decrease in their ΔO. F, Mean ΔO for the cells shown in scatter plot after MD (mean ΔO = 52.7° ± 3.5) and then again following EE (ΔO = 21.0° ± 2.3°, *p < 0.05).
