Figure 3.
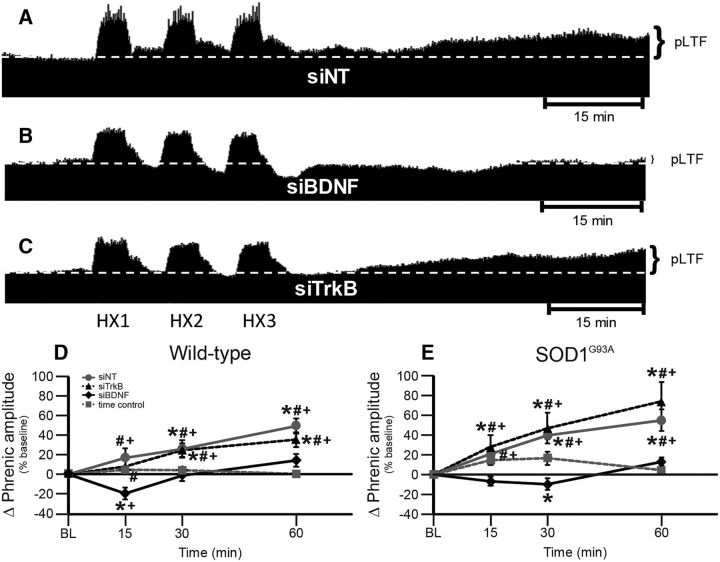
pLTF in siRNA-treated rats. A–C, Representative traces of compressed, integrated phrenic nerve activity before and after AIH in end-stage SOD1G93A rats pretreated with siNT (A), siBDNF (B), or siTrkB (C). White, dashed line in each trace indicates baseline. AIH elicits pLTF in siNT-pretreated and siTrkB-pretreated rats, but was nearly abolished in siBDNF-pretreated rats. D, E, Phrenic burst amplitude (percentage change from baseline) in wild-type (D) and SOD1G93A (E) rats pretreated with siNT (gray circles with gray solid line), siTrkB (black triangles with black dashed line), or siBDNF (black diamonds with black solid line), or TCs (gray squares with gray dashed line). pLTF is significantly increased in wild-type and SOD1G93A rats treated with siNT or siTrkB compared with baseline (+) and with TCs (*), indicating pLTF. Wild-type and SOD1G93A rats treated with siBDNF had a significantly smaller pLTF compared with baseline (+) or with TCs (*; at only 15 min after hypoxia for wild type and only 30 min after hypoxia for SOD1G93A) and with siNT-treated or siTrkB-treated rats (#; all time points after hypoxia). Values are means ± 1 SEM and all significant differences are p < 0.05.

