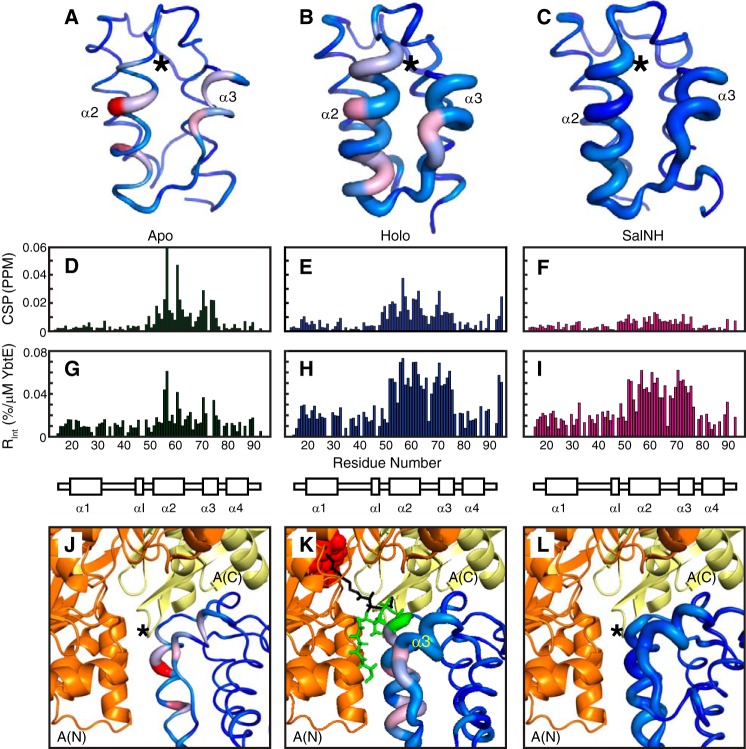
Figure 4.
Spectroscopic perturbations induced by YbtE binding to apo-ArCP (A, D, G, and J), holo-ArCP (B, E, H, and K), and SalNH-ArCP (C, F, I, and L). A–C, CSPs and Rint plotted on the structures of ArCP. Global maxima (accounting for all forms) are used. CSPs are represented by a color gradient from blue (no CSP) to red (global maximum CSP in D–F), and Rint is represented by the thickness of the sausage, with the thickest line representing the maximum value in G–I. *, position of Ser52. D–F, CSPs representing shifts in HN-HSQCs of 1:0.125 ArCP/YbtE. For all forms, perturbations occur on α2 and α3, but they localize on the surface for apo-ArCP. G–I, relative change in intensity upon the addition of 0.125 eq of YbtE, Rint. Only specific residues are affected in apo-ArCP, but most residues in α2, α3, and loop 2 show dramatic changes in intensity for holo-ArCP and loaded ArCP. J–L, comparison between spectroscopic perturbations due to YbtE binding and a complex trapped in crystallographic studies for apo-SalNH (J), holo-SalNH (K), and SalNH-ArCP (L). Each form of ArCP (Protein Data Bank entries 5TTB (apo; this work), 2N6Y (holo), and 2N6Z (loaded)) was aligned onto EntB-ArCP in the EntE-EntB complex, Protein Data Bank entry 3RG2. For holo-ArCP (K), the phosphopantetheine group is shown in green when docked with ArCP and in black when extended between the N-terminal A(N) and C-terminal A(C) subdomains of EntE. The adenylate mimic used in the crystallographic study is shown in red spheres.

