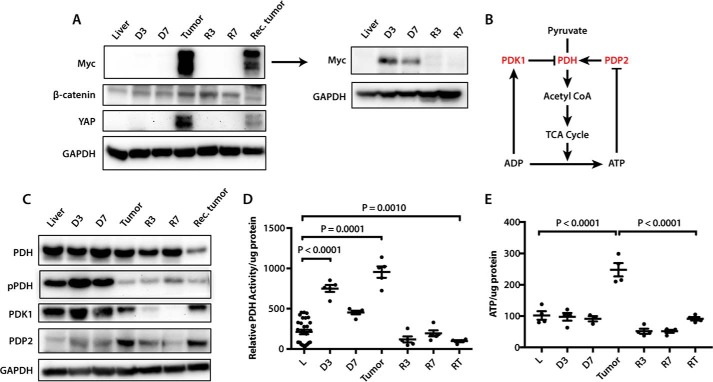
Figure 1.
Immunoblot profiling of liver and tumor samples. A, expression of Myc, β-catenin, and YAP in livers and HCCs. Tissues examined included control, D3 and D7 livers, initial tumors, R3 and R7 regressing tumors, and recurrent tumors. The adjacent Myc blot is a repeat of the one shown to the left with both tumor samples removed to allow a longer exposure and reveal the lower but still overexpressed levels of Myc in D3 and D7 liver samples. See supplemental Fig. S2A for additional immunoblots and supplemental Table S6 for band density quantification. B, phosphorylation-dependent regulation of PDH by the inhibitory kinase Pdk1 and the stimulatory phosphatase Pdp2 (27). High ATP/ADP ratios concurrently stimulate Pdk1 and inhibit Pdp2, thereby down-regulating PDH activity and limiting pyruvate's conversion to AcCoA (27). C, immunoblots showing total PDH and phospho-Ser293 PDH E1α subunit (pPDH), an indicator of relative PDH inactivity. Also examined were total amounts of PDK1 and PDP2. See supplemental Fig. S2B for additional immunoblots and supplemental Table S6 for band density quantification. D, PDH enzymatic activity in fresh tissue samples. Groups were compared with ANOVA, and each group was compared with control liver with two-sided t tests with Welch's correction due to heteroskedasticity and Bonferroni correction to control for false discovery (adjusted 0.0083̄). n = 4–5 samples/group except control liver, with 29 samples. The release of 14CO2 during the conversion of 14C-labeled pyruvate to AcCoA was monitored as described previously (30). E, ATP levels were quantified with 3–4 samples per group, each assayed in triplicate, and were compared with ANOVA and Tukey's multiple comparisons two-sided t tests.

