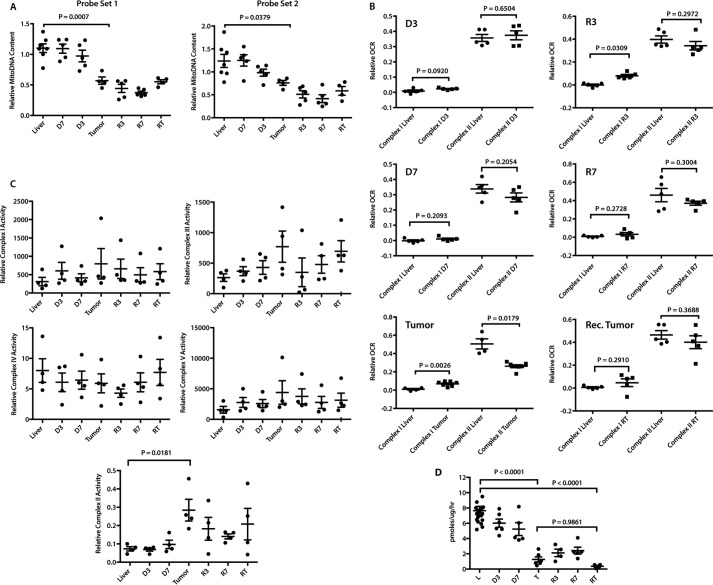
Figure 2.
Changes in mitochondrial structure and function during HCC evolution. A, mitochondrial mass. Mitochondrial DNA (mtDNA) content was assessed with two TaqMan probe sets (probe set 1 and probe set 2) designed to amplify distinct regions of the mitochondrial genome. Results were normalized to those of a parallel PCR that amplified a segment of the apolipoprotein B gene (30) and compared with ANOVA and Tukey's multiple comparisons two-sided t tests. n = 4–7 samples/group. B, activities of ETC complexes I and II in intact mitochondria. OCRs were quantified on liver and tumor mitochondrial suspensions by respirometry (30, 31) and compared with Mann-Whitney U tests. Combined complex I + II activities were evaluated by measuring peak OCRs in response to pyruvate, malate, glutamate, and ADP followed by the addition of succinate. After adding rotenone to inhibit complex I, the individual contributions of complex I and complex II were calculated and normalized to protein content. n = 5–7 samples/group. C, ETC complex function. BNGE was performed on liver and tumor samples from each of the indicated groups (30, 31) and compared with ANOVA and Dunnett multiple comparisons two-sided t tests. The relative abundance of each complex was determined by densitometric scanning (supplemental Fig. S3A) and used to normalize in situ enzymatic activities. Complexes I–V measured NADH ubiquinone oxidoreductase, succinate dehydrogenase, decylubiquinol cytochrome c oxidoreductase, cytochrome c oxidase, and ATPase, respectively (31). SDH activity of complex II was measured on total tissue lysates rather than by in situ assay and was log-transformed for analysis to satisfy ANOVA's homoskedasticity requirement. n = 4 samples/group. D, reduced FAO oxidation by initial and recurrent tumors. [3H]Palmitate conversion to water-soluble products was measured from the indicated groups of mice and compared with ANOVA and Tukey's multiple comparisons two-sided t tests. n = 4–5 samples/group except in control liver, which had 18 samples.

