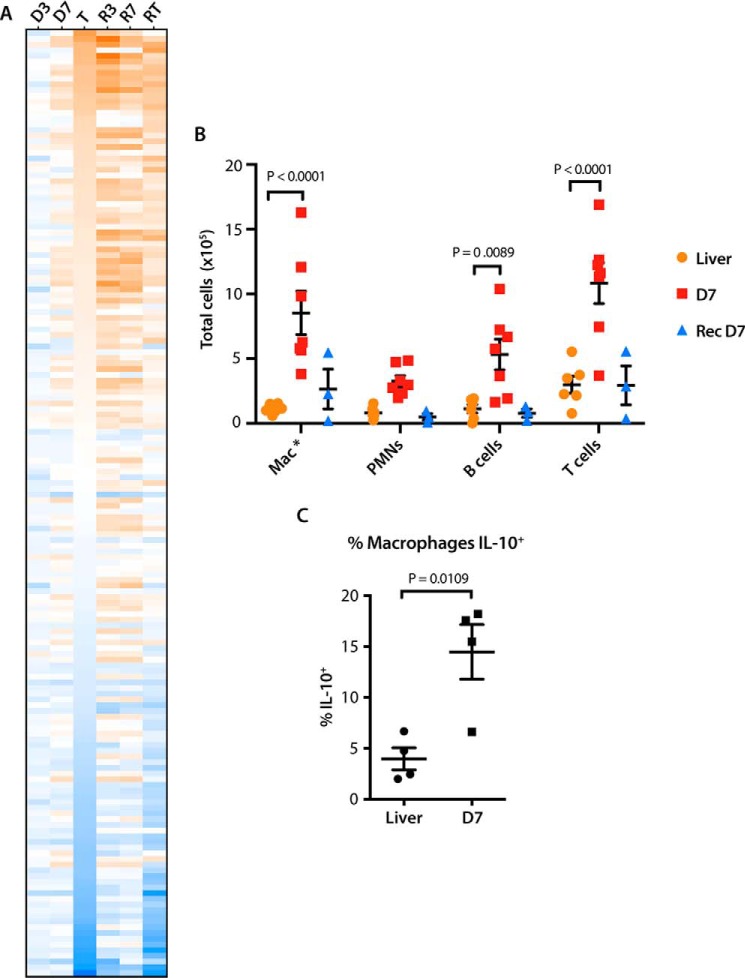
Figure 4.
D7 livers demonstrate up-regulation of markers of the innate immune response and infiltration by inflammatory cells. A, heat map showing changes in the expression of transcripts encoding inflammatory cytokines, chemokines, and chemotactic factors pertaining to innate and adaptive immunity. The transcript order is arranged from highest to lowest levels of expression in initial tumors. B, total numbers of hematopoietic cells isolated from control livers, D7 livers, or regressed livers, which were to again overexpress Myc for 7 days (recurrent D7). Compared with two-way ANOVA and Dunnett's multiple comparison two-sided t tests. n = 3–7 samples/group. C, intracellular cytokine staining for IL-10 was performed on infiltrating (CD68+, CD11b+) macrophages following brief exposure to lipopolysaccharide as described under “Experimental procedures” and compared with a two-sided t test assuming homoskedasticity. n = 4 samples/group.

