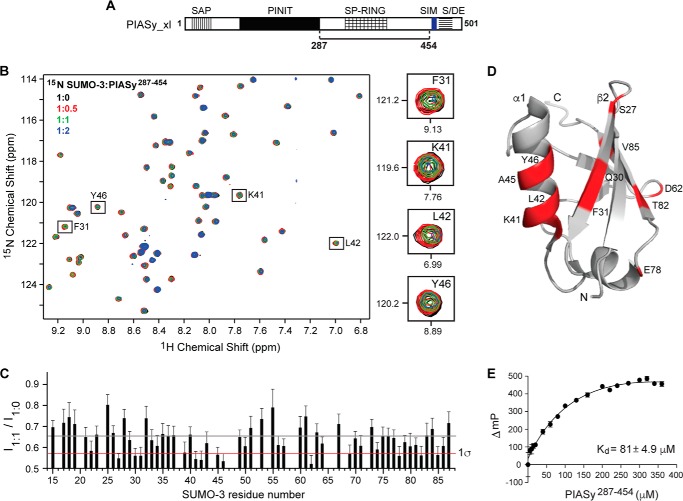
Figure 2.
Analysis of the interaction of SUMO-3 with PIASy lacking the original SIM. A, PIASy schematic as in Fig. 1A with the solid line indicating the fragment, residues 287–454, used in the NMR and FP experiments. B, 2D 1H-15N HSQC spectra of 15N-labeled SUMO-3 titrated with increasing molar ratios of PIASy(287–454). Expanded sections of representative SUMO-3 residues affected upon binding of PIASy(287–454) are shown on the right. C, plot of relative peak intensity for all assigned, non-overlapping SUMO-3 resonances in the ligand-bound versus -free form (I1:1/I1:0). Gray and red lines depict mean and one standard deviation from the mean (1σ), respectively. D, SUMO-3 residues displaying significant peak intensity reduction upon complex formation with PIASy(287–454) are highlighted red. E, fluorescence polarization binding assay of fluorescein maleimide-labeled SUMO-3 titrated with increasing concentrations of PIASy(287–454). ΔmP, change in millipolarization. Error bars represent S.D.

