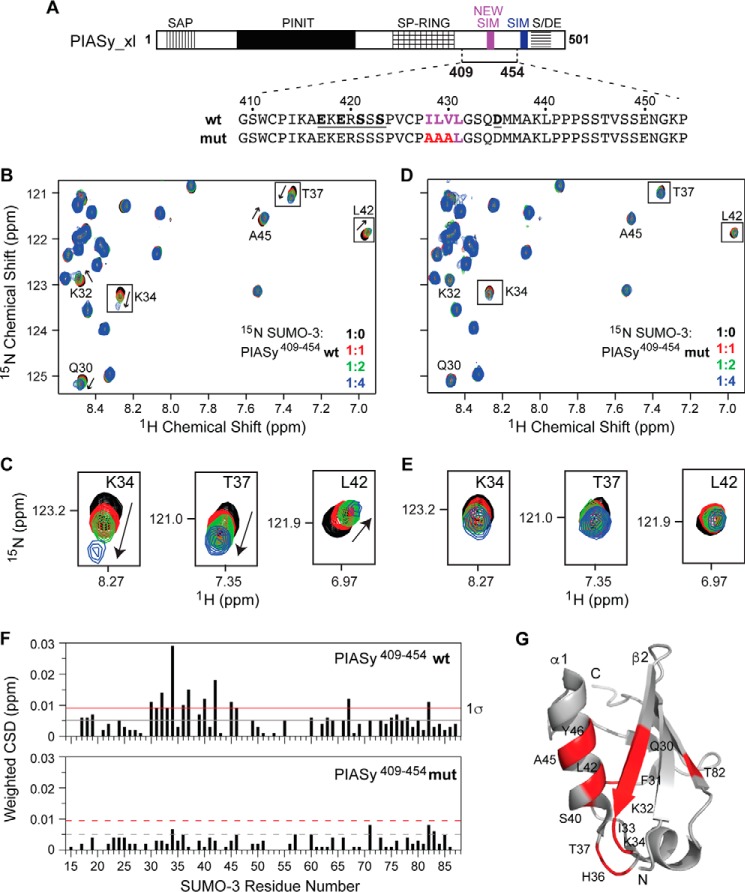
Figure 4.
Characterization of the binding of SUMO-3 and the new SIM of PIASy. A, PIASy schematic as in Fig. 1A with new SIM shown in magenta. The solid bar corresponds to the PIASy fragment 409–454 (which contains the new SIM but lacks the original SIM) used in the experiment. The sequences of the WT and mut PIASy construct are shown. B, a section of the 2D 1H-15N HSQC spectra of 15N-labeled SUMO-3 titrated with increasing molar ratios of WT PIASy(409–454) demonstrates specific SUMO-SIM binding. C, expanded sections of selected SUMO-3 residues affected upon binding of WT PIASy(409–454). D and E, similar to B and C for SUMO-3 titrations with mut PIASy(409–454). F, plots of weighted CSD from titrations of SUMO-3 with WT PIASy(409–454) (top) and mut PIASy(409–454) (bottom). Gray and red lines correspond to the mean and one standard deviation (1σ) from the mean, respectively. G, SUMO-3 residues that are strongly affected by the binding of WT PIASy(409–454) are colored red.

