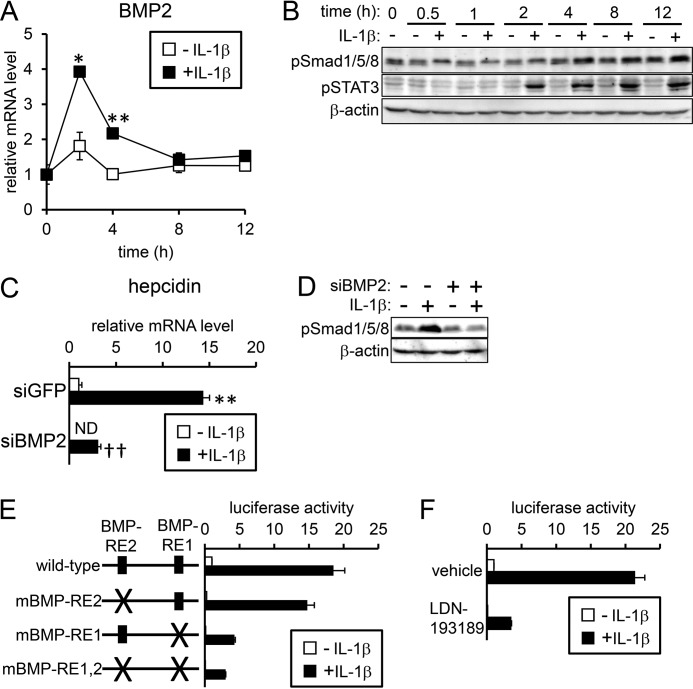
Figure 2.
IL-1β-induced hepcidin transcription via regions other than BMP-REs. A and B, HepG2 cells were treated with IL-1β (25 ng/ml) for the indicated time. A, expression of BMP2 was examined by RT-qPCR analysis. The expression level in the control cells prior to IL-1β treatment was defined as 1. The data are presented as the mean ± S.E. (n = 3). *, p < 0.05 and **, p < 0.01 versus cells treated without IL-1β at the respective time point. B, levels of phosphorylated Smad1/5/8 and STAT3 were examined by Western blot analysis with β-actin as the loading control. C and D, HepG2 cells were transfected with siRNA targeting the indicated gene. At 48 h after transfection, cells were treated with IL-1β (25 ng/ml) for 4 h. Expression of hepcidin was examined by RT-qPCR analysis. The expression level in cells transfected with siGFP and treated without IL-1β was set at 1. The data are presented as the mean ± S.E. (n = 3). *, p < 0.05 and **, p < 0.01 versus cells transfected with the respective siRNA without IL-1β treatment. † and ††, p < 0.05 and p < 0.01 versus cells with corresponding IL-1β treatments and transfected with siGFP. D, levels of phosphorylated Smad1/5/8 were examined by Western blot analysis with β-actin as the loading control. E and F, HepG2 cells were transfected with tk-Renilla-luc and either the indicated reporters (E) or hepcidin(−2018)-luc (F). At 4 h post-transfection, cells were treated with or without IL-1β (10 ng/ml) for 12 h. Cells were also pretreated with or without LDN-193189 (100 nm, F). Firefly luciferase activity normalized to Renilla luciferase activity was calculated, and the relative luciferase activity in untreated cells transfected with hepcidin(−2018)-luc was defined as 1. The data are presented as the mean ± S.E. (n = 3).

