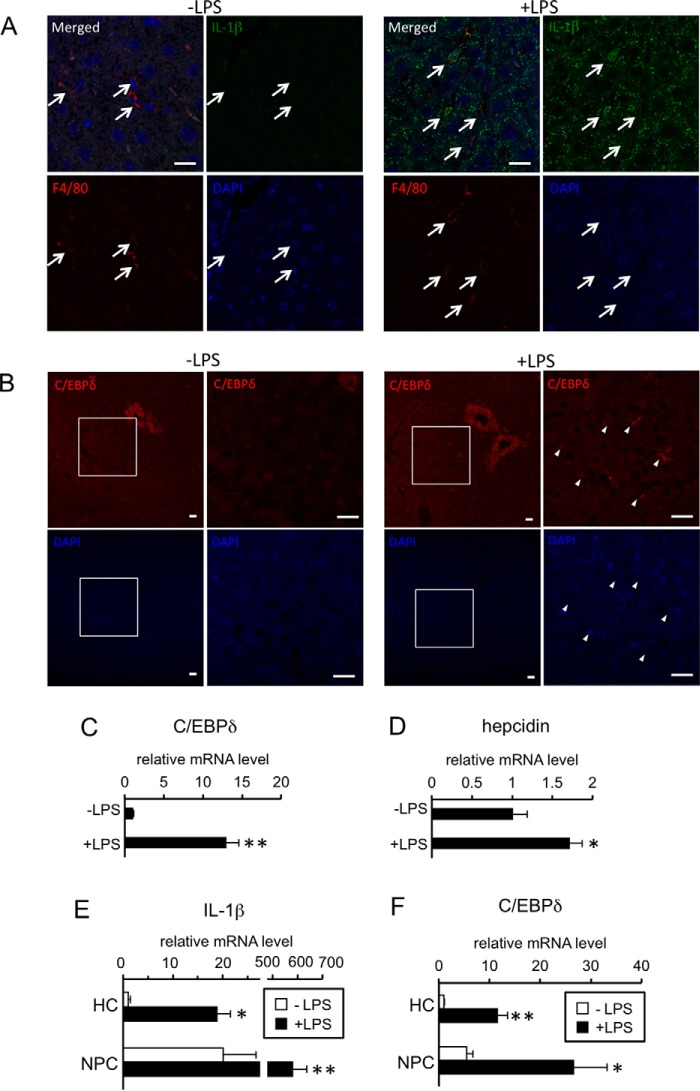
Figure 8.
Localization of IL-1β and C/EBPδ in LPS-treated livers and hepatic expression of genes in response to LPS. A–D, C57BL/6 mice were intraperitoneally injected with PBS or LPS (5 mg/kg). At 6 h post-injection, the livers were recovered. Localization of IL-1β (A) and C/ebpδ (B) was examined by immunohistochemistry. A representative result of the livers from LPS-treated mice is shown. Scale bar: 20 μm. A, upper: localization of IL-1β-positive cells (green, IL-1β antibody). Arrows, Kupffer cells (red, F4/80 antibody). B, upper: localization of C/ebpδ-positive cells (red). Area surrounded by a square in the left panel of each treatment was enlarged and shown in the right panel. Arrowheads: C/ebpδ-positive sinusoidal endothelial cells. C and D, expression of C/ebpδ (C) and hepcidin (D) was examined by RT-qPCR analysis. The levels in the control mice were defined as 1. The data are presented as the mean ± S.E. (n = 4). * and **, p < 0.05 and p < 0.01, respectively, versus PBS-treated liver. E and F, hepatocytes (HC) and non-parenchymal cells (NPC) were isolated from livers of ICR mice injected with PBS or LPS (5 mg/kg) intraperitoneally 6 h prior to sacrifice. Expression of IL-1β (E) and C/ebpδ (F) was examined by RT-qPCR analysis. The levels in the hepatocytes from PBS-treated liver were defined as 1. The data are presented as the mean ± S.E. (n = 4). * and **, p < 0.05 and p < 0.01, respectively, versus corresponding cells from PBS-treated liver. † and ††, p < 0.05 and p < 0.01 versus hepatocytes from liver with corresponding treatment.

