
Figure 3.
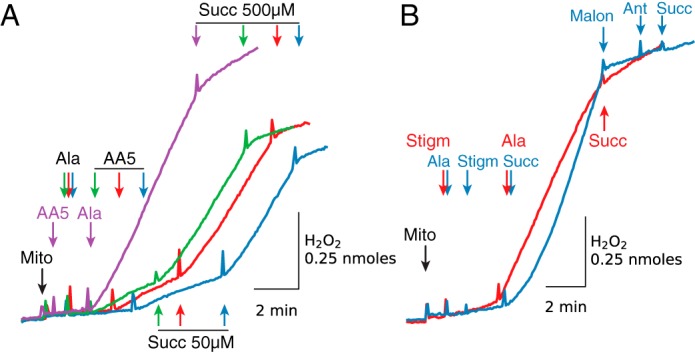
H2O2 production by inhibited complex II is maximized when mitochondria are permeabilized after AA5 (A) or stigmatellin (B) addition. A, compared with AA5 addition before alamethicin (Ala, purple trace), AA5 (0.5 μm) added 1 min (green trace), 2 min (red trace), and 3 min (blue trace) after alamethicin resulted in reduced H2O2 production. Low H2O2 production was enhanced by adding 50 μm succinate (Succ) but suppressed by 500 μm. B, alamethicin added after stigmatellin (Stigm) (2 μm) induced a rapid increase in H2O2 production that was inhibited with 5 mm succinate (red trace). Stigmatellin added after alamethicin (blue trace) had little effect, but H2O2 production was increased with a low concentration of succinate (75 μm) and inhibited with malonate (Malon) (5 mm). Note that ROS production by antimycin (Ant)-inhibited complex III after addition of 5 mm succinate was inhibited due to the presence of stigmatellin (blue trace). As in other figures, additions to all traces are indicated by black arrows; additions to one trace only are indicated by the arrows of the same color as the trace. Mito, mitochondria.