Figure 5.

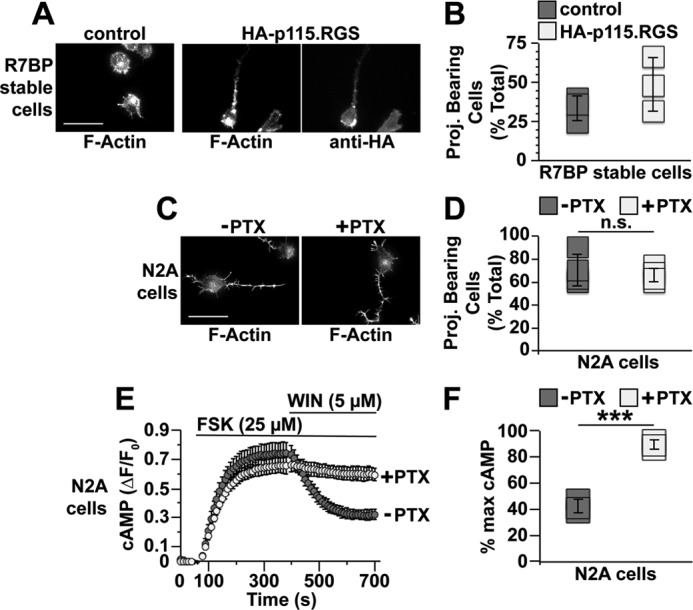
Gα12/13 activity rather than Gαi/o activity regulates neurite formation by serum-starved N2a cells. N2a cells lacking or stably expressing 3xFLAG-R7BP were plated, differentiated, fixed, stained, and scored as described in Fig. 4 and under “Experimental procedures.” A, representative fluorescence images of cells stably expressing FLAG-R7BP and transfected with either GFP (control) or HA-p115·RGS. B, quantification of neurite formation under conditions shown in A. In these experiments, all cells quantified were transfected, whereas those in Fig. 4E were not transfected, which likely explains why the percentage of R7BP-expressing cells bearing neurites in response to serum starvation was different between the two types of experiments. Each box represents a data point from one of three independent experiments. C, representative fluorescence images of parental N2a cells treated with PTX. D, quantification of the neurites formed by cells under conditions described in C. Each box represents a data point from one of four independent experiments. E, inhibition of Gi/o signaling by PTX in N2a cells. N2a cells were transfected with the cAMP FRET sensor Epac-SH187 and treated for 16–24 h with or without 100 ng/ml PTX. Baseline cAMP levels were recorded for 1 min, and then cells were treated with 25 μm forskolin (FSK) to stimulate cAMP production. After 5 min of forskolin treatment, endogenous Gi/o-coupled cannabinoid type 1 receptors were activated by addition of 5 μm WIN 55,212-2 (WIN), and cAMP levels were recorded for an additional 5 min. Data shown are the averages of three independent experiments. F, quantification of percent maximum cAMP levels after WIN 55,212-2 stimulation as shown in E. Percent maximum (% max) cAMP = [(minimum ΔF/F0)/(maximum ΔF/F0)] × 100. Each box represents a data point from one of three independent experiments. Scale bars, 50 μm. Error bars indicate standard deviation of the mean. Statistical significance was determined using two-tailed, two-sample Student's t test assuming equal variance as deemed appropriate by F-test analysis. ***, p < 0.001; n.s., p > 0.05. Proj., projection.
