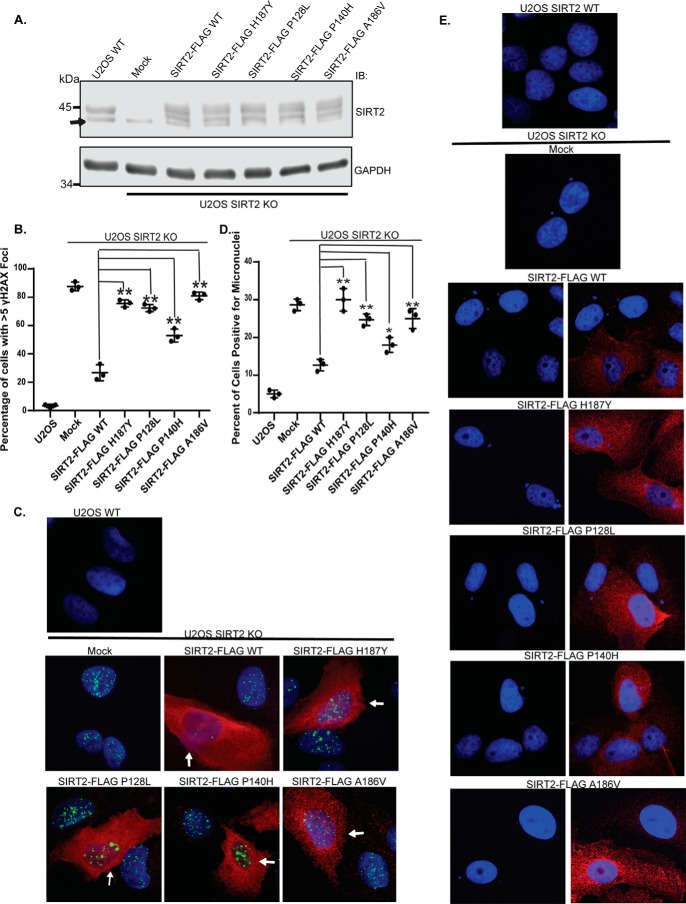
Figure 6.
Cancer-associated SIRT2 mutations fail to rescue genomic instability of SIRT2 deficiency. A, U2OS SIRT2 KO cells generated by CRISPR/Cas9 were complemented with or without SIRT2-FLAG WT or mutants. Western blot analysis demonstrating efficiency of expression of SIRT2-FLAG WT and mutants in U2OS SIRT2 KO cells or endogenous SIRT2 in U2OS WT cells is shown. The arrow indicates a nonspecific band beneath the SIRT2 protein band. B, U2OS SIRT2 KO cells demonstrate increased spontaneous γH2AX foci and were complemented with or without SIRT2-FLAG WT or mutants. The degree of alleviation of spontaneous γH2AX foci observed was quantified. Quantitation of the percentage of cells with >5 spontaneous γH2AX foci is shown. The mean was calculated from three replicas of 100 cells for each condition, and error bars represent S.D. *, p < 0.05; **, p < 0.01. C, representative images of U2OS SIRT2 KO cells complemented with or without SIRT2-FLAG WT or mutants and stained for γH2AX foci (green), FLAG (red), and DAPI. U2OS SIRT2 KO cells with SIRT2 construct expression stain positive for FLAG (red), and examples of this are highlighted by white arrows, whereas cells in the same population that did not express SIRT2 construct do not exhibit red staining in the cytoplasm. D, U2OS SIRT2 KO cells were transfected with or without SIRT2-FLAG WT or mutants and stained for FLAG in red and DAPI. Induced micronuclei were counted. Quantitation of micronuclei is shown. The mean was calculated from three replicas of 100 cells for each condition, and error bars represent S.D. *, p < 0.05; **, p < 0.01. E, representative images of micronuclei conditions from D. IB, immunoblotting.

