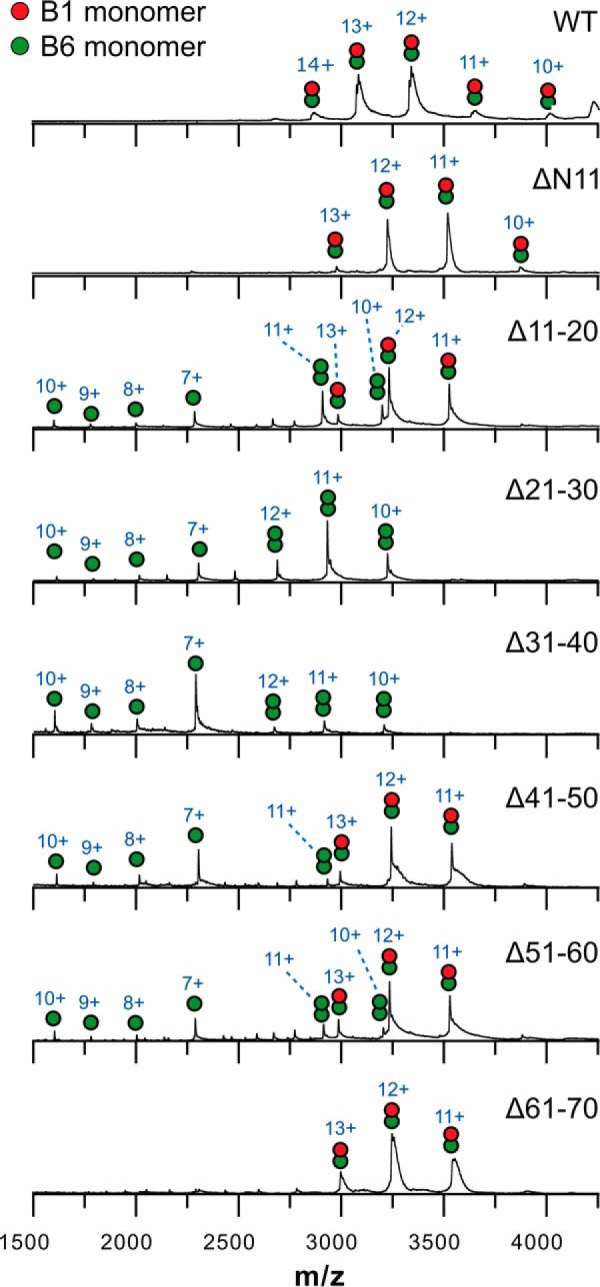
Figure 3.

Native mass spectrometry analysis of mixtures of HSPB1 and the HSPB6 deletions. 20 μm (monomer concentration) of each preincubated mixture in 200 mm ammonium acetate, pH 6.9, containing 2.5 mm DTT was analyzed on a Synapt G2 HDMS (Waters). Charge states are indicated above each peak.
