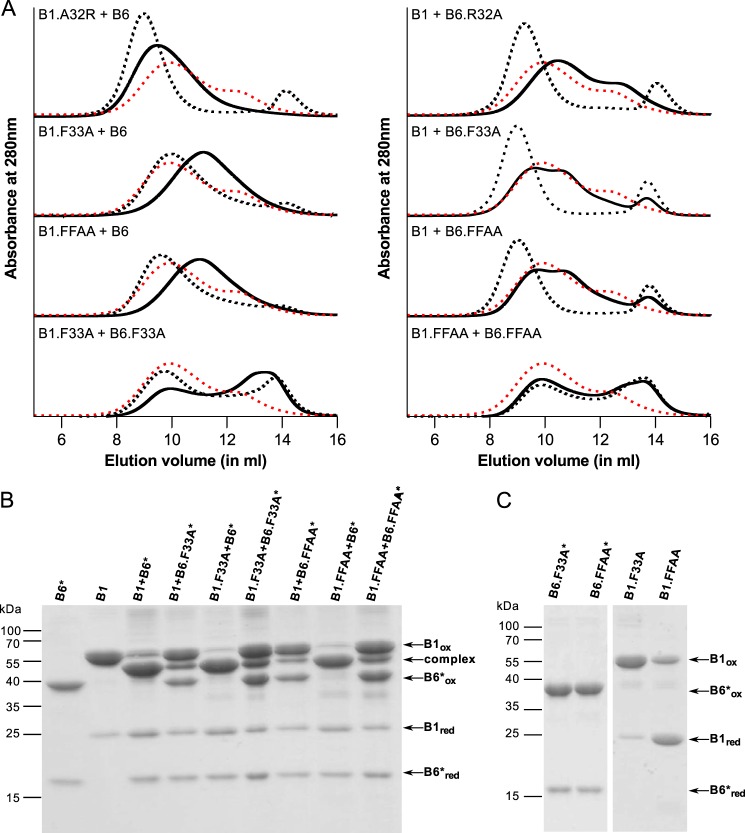
Figure 8.
Point mutation analysis of the conserved region in HSPB1 and HSPB6. A, analytical SEC profile of an equimolar mixture of various HSPB1 and HSPB6 point mutations following overnight incubation at 37 °C. The control sample (stored at 4 °C) is shown as a black dashed line, and the hetero-oligomer (incubated at 37 °C) is shown as continuous black line. For each chromatogram, the hetero-oligomer for WT HSPB1 and HSPB6 is shown as a red dashed line. B, non-reducing SDS-PAGE analysis of the complex between HSPB1 and HSPB6* point mutants. C, control experiment showing the non-reducing SDS-PAGE analysis of different constructs following extensive dialysis to remove DTT.

