Figure 2.
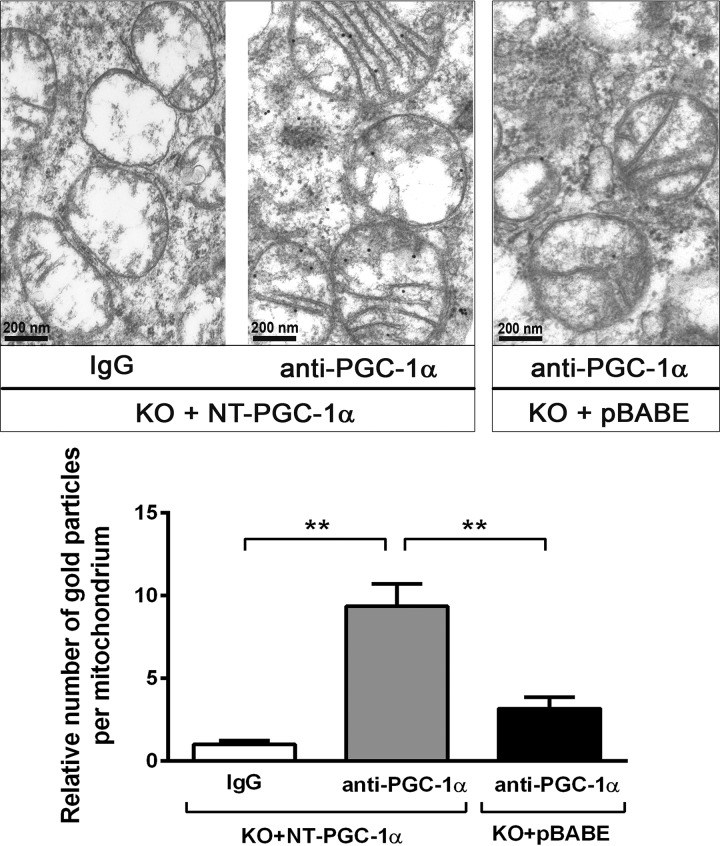
NT-PGC-1α localizes in the mitochondrial matrix. Immunotransmission electron microscopic analysis of NT-PGC-1α in brown adipocytes. Black dots represent immunogold particles reacted with PGC-1α antibody in PGC-1α−/− brown adipocytes (KO) expressing NT-PGC-1α or an empty vector (pBABE). Mitochondrial localization of immunogold particles was examined in 6–8 grids/group (20–30 mitochondria/grid), and the relative number of immunogold particles localized in the mitochondria in each group is shown in the bottom panel. Data are presented as the mean ± S.E. One-way ANOVA was used to compare the difference between groups: **, p < 0.01.

