Figure 5.

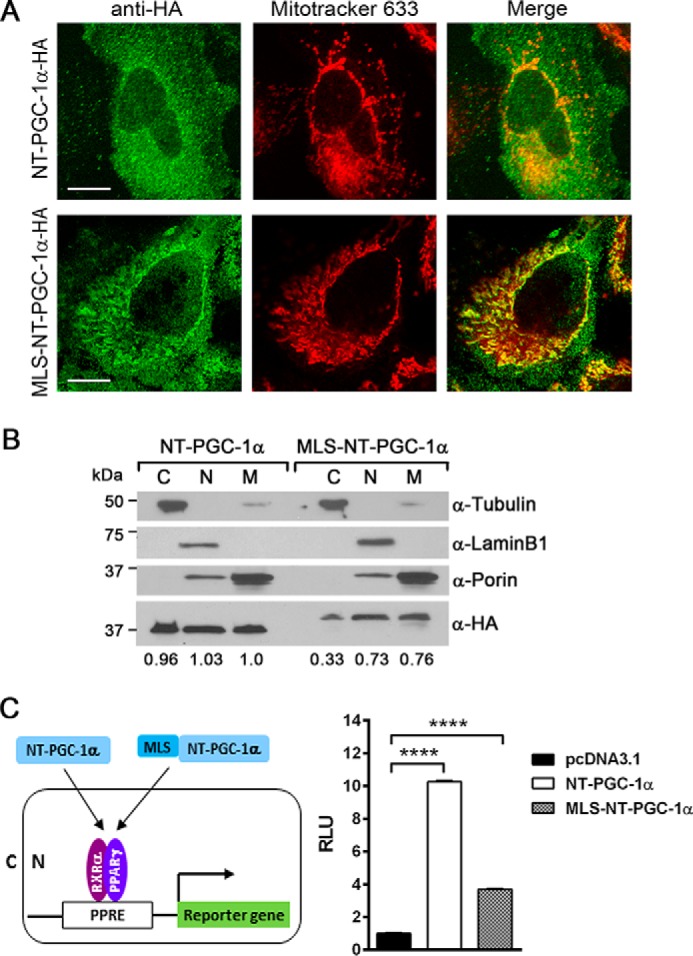
Increased mitochondrial targeting of NT-PGC-1α by addition of MLS. A, cellular localization of NT-PGC-1α and MLS-NT-PGC-1α. HeLa cells were transfected with NT-PGC-1α-HA and MLS-NT-PGC-1α-HA using FuGENE 6. Immunofluorescence was carried out using anti-HA antibody and MitoTracker Deep Red 633. Scale bars = 23 μm. B, subcellular distribution of NT-PGC-1α-HA and MLS-NT-PGC-1α-HA in HeLa cells. Relative protein levels of NT-PGC-1α-HA and MLS-NT-PGC-1α-HA in cytoplasmic (C), nuclear (N), and mitochondrial (M) fractions were determined by densitometric analysis using ImageJ as described under “Experimental Procedures.” C, effect of NT-PGC-1α and MLS-NT-PGC-1α on PPARγ/RXRα-mediated reporter gene expression in the nucleus. NT-PGC-1α or MLS-NT-PGC-1α was co-transfected with a luciferase reporter gene containing three copies of PPAR-binding sites, PPARγ, RXRα, and a Renilla luciferase reporter gene in HeLa cells. Luciferase activity was determined after 48-h transfection and normalized with Renilla luciferase activity. Data represent the mean ± S.E. of three independent experiments. One-way ANOVA was used to compare the difference between groups: ****, p < 0.0001. RLU, relative light units.
