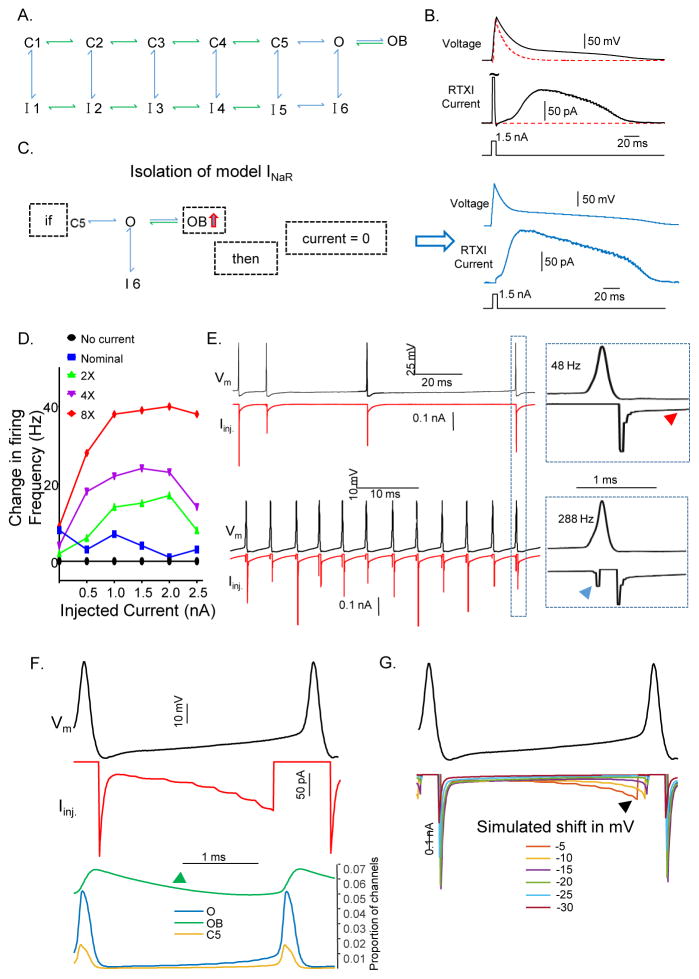
Figure 7. Dynamic clamp-mediated addition of INaR rescues high frequency firing in Scn4b−/− Purkinje neurons.
A, Schematic of a thirteen state Markov model describing the transient, persistent and resurgent components of the Nav currents in cerebellar Purkinje neurons (see: Supplemental Experimental Procedures B, Brief depolarizing current injections (bottom traces) were delivered to a model cell and the resulting change in voltage (upper trace), as well as the RTXI current injected (middle trace), were measured. The red dashed line reveals the voltage change of the model cell without the addition of INa. C, Left- To isolate and apply the resurgent portion of the INa model in dynamic clamp, if the proportion of channels in the OB state was increasing, the RTXI current was set to 0. Right- With the fast transient portion of the Nav current excluded, the resurgent Nav current was isolated. See also Figure S4. D, Change in the instantaneous firing frequency of a Purkinje neuron in response to 0.0–2.5 nA (x-axis) of depolarizing current with different amounts of modeled INaR added to the cell via dynamic clamp. E, Representative action potentials (black) and RTXI currents (red) are illustrated. Upper traces show INaR in a Purkinje neuron firing at 48 Hz, and the lower traces show INaR in a Purkinje neuron firing at 288 Hz. Boxes (on the right) provide increased temporal resolution to display INaR activation during a single action potential; the red arrow indicates INaR during the inter-spike interval and the blue arrow indicates INaR during the upswing of the action potential. F, Plots of the changes in the O (blue), OB (green) and C5 (yellow) states as a function of time during action potentials; INaR is also illustrated (red). The proportion of channels in the OB state (green arrow) is decreasing during the inter-spike interval. G, Purkinje neuron action potential (black) waveforms generated in Matlab with the INaR model applied. Hyperpolarization of the membrane voltage in 5 mV increments alters the time course of INaR activation during the inter-spike interval.

