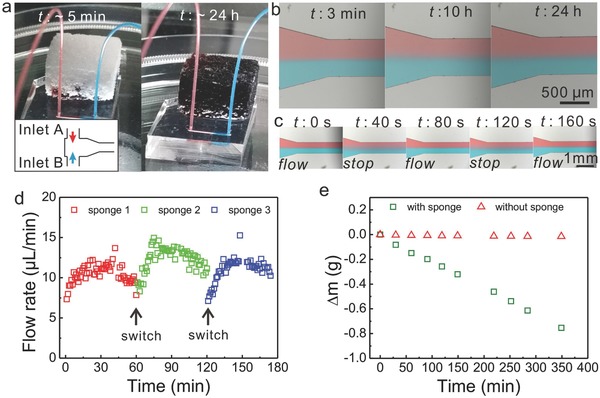
Figure 4.

a) Digital images of the T‐junction microchip driven by a hydrophilic PVA‐PDMS sponge pump at the beginning (left) and after 24 h (right). b) Microscopic images of the laminar flow pattern generated in (a) at different time. c) “Stop‐flow” manipulation of the flows visualized by the breakdown and recovering of the laminar flow. d) Quasi‐stable high flow rates maintained by switching sponge pumps with unloaded ones at an interval of 1 h. e) Measurement of water evaporation rate with and without sponge pumps.
