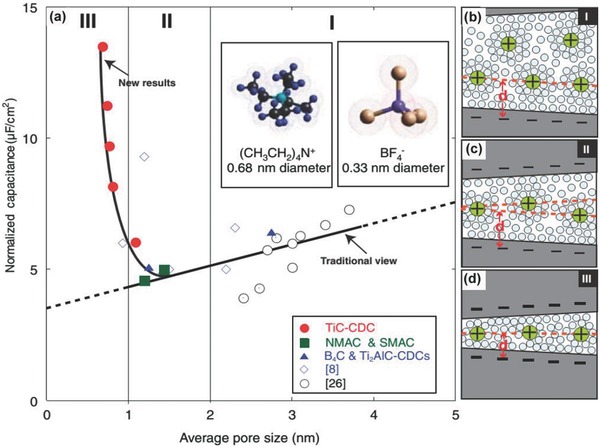
Figure 8.

a) Plot of specific capacitance normalized by BET specific surface area and average pore size for the carbons. b–d) Drawings of solvated ions with distance between adjacent pore walls to illustrate distinguishing behavior schematically: (b) greater than 2 nm, (c) between 1 and 2 nm, and (d) less than 1 nm. Reproduced with permission.163 Copyright 2006, AAAS.
