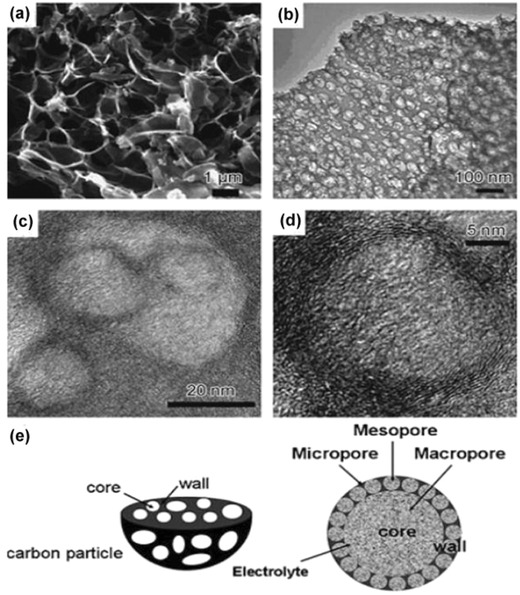
Figure 10.

a) SEM image of the macroporous cores, b) TEM image of the mesoporous walls, c) TEM image of the micropores, d) high‐resolution TEM image of the localized graphitic mesopore walls, and e) schematic representation of the three‐dimensional porous texture. Reproduced with permission.213
