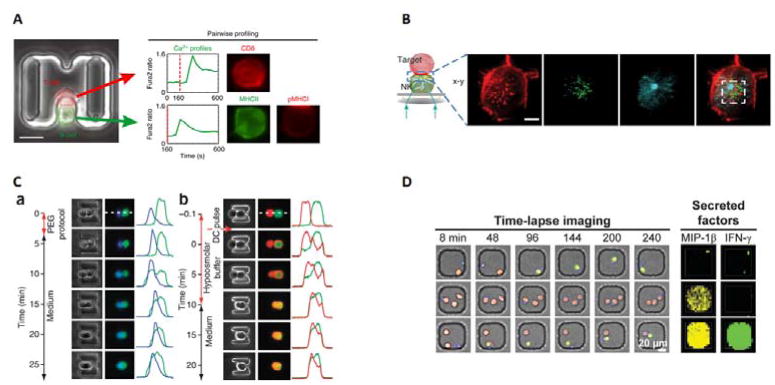
Figure 2.
Applications of cell pairing for communication studies. A) Immune cell heterogeneity studies. Single cell studies conducted on Ca2+ flux and activation between T cells(red) and B cells(green), where 225 individual cell pairs were tracked and analyzed based on CD8 expression(T cells) and MHCII and pMHC1 expression(B cells)67. The Ca2+ expression is measured by fluorescent signal over time. B) Imaging of the immunological synapse between a natural killer cell and a target cell. The authors were able to image the changes in localization between actin(red), perforin(green) and tubulin(blue) during the killing process46. C) Cell fusion of cells using both chemical and electrical techniques59. (a)Chemical fusion of mouse embryonic stem cells(green) to mouse embryonic(blue). (b)Electrical fusion of two 3T3s cells stained with DsRed and eGFP. Fusion is measured by the distance between fluorescence. D) Time lapse imaging and secretion analysis of NK cells interacting with target cells. NK cells(blue) can contact target cells(red) and subsequently kill the target cells(dead cells turn green through Sytox Green)49 Secreted factors are quantified by microengraving, where antibodies for MIP-1β and IFN-γ are bound to the bottom of the microwell. Secreted proteins are captured by the antibodies, and primary and fluorescent secondary antibodies for MIP-1β(yellow) and IFN-γ(green) bind. Concentration can be quantified by fluorescence intensity. 2A. Reproduced from Ref 67 with permission from Nature Publishing Group. 2B. Reproduced from Ref 46 from The American Association of Immunologist. 2C. Reproduced from Ref 59 with permission from Nature Publishing Group. 2D. Reproduced from Ref 49 with permission from the Royal Society of Chemistry.

